


By Rajiv Kumar, Namrata Dubashi, Rajat Gupta, and Kunwar Singh
Shortly before molten steel is cast into solid shapes at Tata Steel’s plant in Kalinganagar, India, frontline operators put the metal through a process known as superheating, which is necessary to bring the steel to the proper temperature for casting. Superheating can be tricky to get right. Steel reaches more than 1600 degrees Celsius during superheating, and the ideal temperature range spans only 15 degrees. If the steel comes out too hot, the equipment operators must slow the casting step. If the steel isn’t hot enough, it can “freeze” before it has been cast, which compromises its quality.
VideoInsights to Impact: Tata Steel Kalinganagar's analytics transformation with Kunwar Singh
McKinsey partner Kunwar Singh describes key insights from this impact story. Learn more about Kunwar here.
The frontline operators at the secondary-metallurgy station were used to running the superheating process based on past experiences. They would consider prompts from control systems, which were loaded with standard formulas, and then decide what set points to apply so the steel temperature would end up in the target range. Most of the time, they heated two of every three batches of steel into the optimal range. That “strike rate” allowed them to complete 25 “heats” per day, but it also left room for improvement. Bringing the strike rate up to 85 percent or so would result in 28 to 30 heats per day, enough to boost throughput by roughly 8 to 12 percent, or 600 to 900 daily tons.
The opportunity stood out to the plant managers, who had been given a mandate to improve the plant’s performance with advanced analytics. In early 2017, they devised a plan for building analytics models that would help frontline operators get better results from the superheating process and several other activities. Data scientists from Tata Steel and McKinsey used historical information from the plant to build and “train” a superheating-optimization model, which would examine real-time operational data and recommend process set points conducive to a higher strike rate. In addition, managers arranged for some employees to receive classroom training in data science, data engineering, and other advanced-analytics disciplines.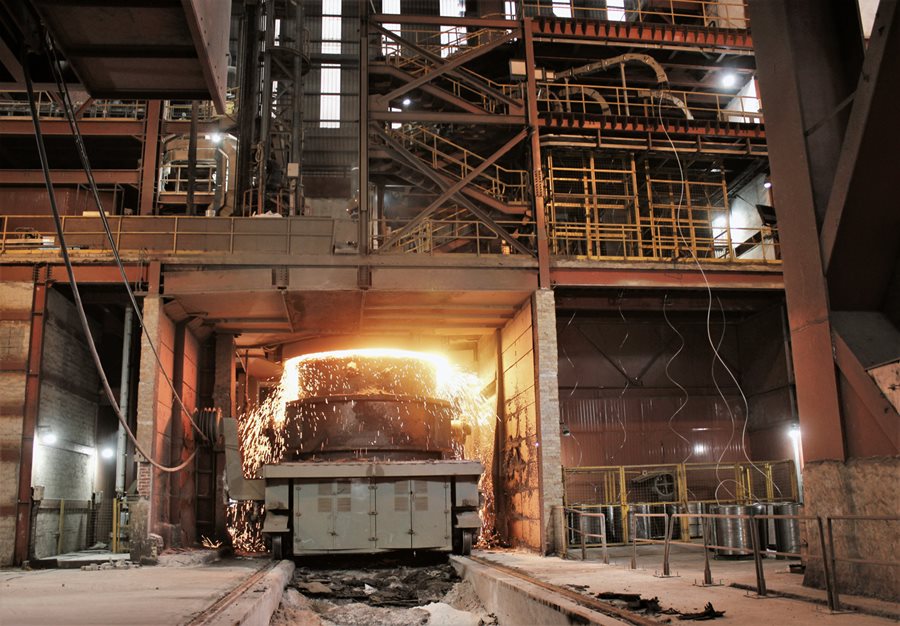
We strive to provide individuals with disabilities equal access to our website. If you would like information about this content we will be happy to work with you. Please email us at: McKinsey_Website_Accessibility@mckinsey.com
The secondary-metallurgy station at the Kalinganagar plant used analytics to increase throughput by better controlling the superheating process.
At first, the superheating model proposed settings that consistently improved the strike rate. But as the mix of steel orders from customers began to differ from the mix of orders recorded in the model’s training data, the model started to generate faulty recommendations—which frontline operators ceased to follow. Employees who had gone through the classroom training tried to fix the model but found the problems too complex to correct using the basic skills they’d learned. Similar difficulties arose with the models being used elsewhere in the plant.
Despite the setback, managers had seen how the advanced-analytics models reduced costs and raised output. Managers also realized that classroom training alone would not prepare employees to sustain those performance improvements. They concluded that the company would need to further cultivate employees’ analytics skills and transform their way of working. Their insight paid off. By building these capabilities, the plant would raise its performance to world-class levels and earn acclaim from the World Economic Forum in July 2019 as one of 44 Lighthouse sites that are leading in the adoption of Fourth Industrial Revolution technologies.
What worked and what didn’t: Lessons from Kalinganagar’s analytics program
Focus on business improvements, not technology improvements. Kalinganagar expanded its use of analytics quickly by targeting performance gains and building tech solutions to achieve them, rather than looking at available technologies and thinking of how to apply them.
Develop analytics talent, instead of outsourcing it. When Kalinganagar’s first-wave analytics models needed updating, the plant didn’t have in-house specialists to fix them. Hands-on training enabled the plant to cultivate the analytics talent that it needed to scale up.
Scale analytics to make it a part of everyone’s way of working. Moving beyond pilot projects produced enough value to convince holdouts to embrace working with analytics. Adoption also increased as frontline employees worked with specialists to create the tools and as managers recognized employees’ success using them.
Preparing for analytics, well ahead of its time
Tata Steel’s multiyear effort to develop analytics capabilities at the Kalinganagar plant can be traced to a decision that executives made in 2005, when the plant was first being designed and built. Analytics technologies were then years away from becoming readily applicable to businesses. Nevertheless, Tata Steel’s executives considered whether they should outfit the plant with instruments and sensors to monitor equipment and processes.
Their decision was less clear-cut than it would have been today—remote-sensing equipment is now affordable and advanced analytics has been broadly adopted. But some executives and managers foresaw that spending money on data-collection gear would prove worthwhile, even though it wasn’t yet clear how the data would be used. Amit Kumar Chatterjee, the plant’s then-head of electrical maintenance, was among those pushing to make the early investment—and even he acknowledged that at the time, the potential applications for advanced analytics were undefined.
“We didn’t have in mind how we’d use the data, except maybe for autonomous process controls. We were living in the world of physical science, where experience and equations matter most. Data science was not even on the horizon,” said Chatterjee. Even the makers of the plant’s machinery resisted adding instrumentation. “Still, we believed we should put on the sensors at that stage because we felt it would be a lot harder later on, when the uses for the data were known.”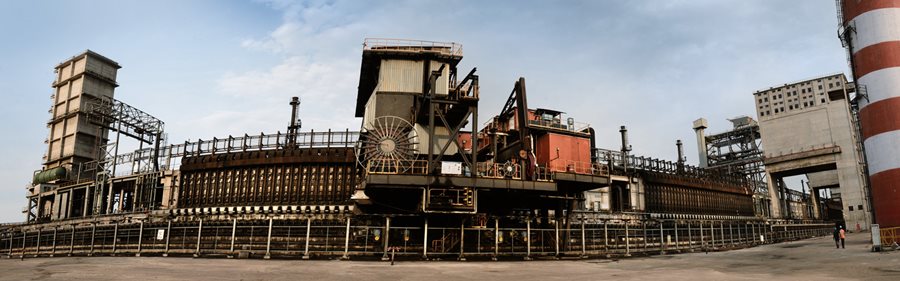
We strive to provide individuals with disabilities equal access to our website. If you would like information about this content we will be happy to work with you. Please email us at: McKinsey_Website_Accessibility@mckinsey.com
The coke-oven plant supplies the Kalinganagar facility with more than 1.5 million tonnes of coke per year.
By the mid-2010s, the leaders of the Kalinganagar plant began looking closely at what they could do with the data the plant’s sensors were collecting. In 2015, T. V. Narendran, the managing director of Tata Steel, set out a $1 billion cost-optimization goal and called on the heads of the company’s plants to map a path toward that goal. One way of boosting performance, he suggested, was to do more with digital technology. Advances in hardware and data science had made it easier for companies to take big data sets, uncover patterns, and make predictions that could help them attain performance improvements.
Leaders at Kalinganagar launched their own investigation into how the plant might apply data science. In 2016, they traveled to Germany and visited technology start-ups and large established companies to get a close look at what data science could do. Early the following year, the plant’s leaders resolved to start an advanced-analytics program at Kalinganagar.
Beginning the analytics transformation
Senior managers at Kalinganagar decided to try advanced analytics on several pilot projects. During a two-day workshop, managers and operations specialists worked with McKinsey experts to identify ten possible uses for analytics and selected three to focus on—one of which involved the superheating process in the plant’s secondary-metallurgy station. Managers wanted to create an advanced-analytics model that could assess conditions in the plant and calculate how much heat to apply during superheating so that the steel would emerge in the target temperature range.
The team working on the superheating model sought to discern which variables were the most important determinants of the steel’s final temperature, and thereby learn how operators could improve the strike rate. They pulled together two years’ worth of operational data that had been generated by sensors or recorded manually in logbooks. Data scientists wrote algorithms to make connections among key factors: measures of the condition of the steel as it reached the secondary-metallurgy station, equipment settings that operators would adjust during the superheating cycle, and other settings that couldn’t be adjusted during a cycle but could be altered over time (such as the maximum rate of oxygen flow, capped by the equipment already in place).
Preliminary results from several pilot projects convinced leaders at Tata Steel Kalinganagar to expand the analytics effort. They laid out five operational areas in which they wanted to improve critical performance indicators and believed that analytics could help.
After two weeks, the team had built a model capable of predicting, with 75 percent accuracy, whether a group of set-point recommendations would cause the molten steel to reach the casting station in the desired temperature range. The other two pilot-project teams built models of similar reliability. Although none of the models had yet been put to the test on the plant floor, the preliminary results convinced leaders at Kalinganagar to expand the analytics effort and create models that employees would actually use.
In September 2017, leaders laid out five operational areas in which they wanted to improve the plant’s critical performance indicators—energy consumption, throughput, quality, and yield—and believed that analytics could help. They chose to carry over the work on the superheating model to the first full phase of the project. Together, the five areas had the potential to enhance margins by $10 million annually.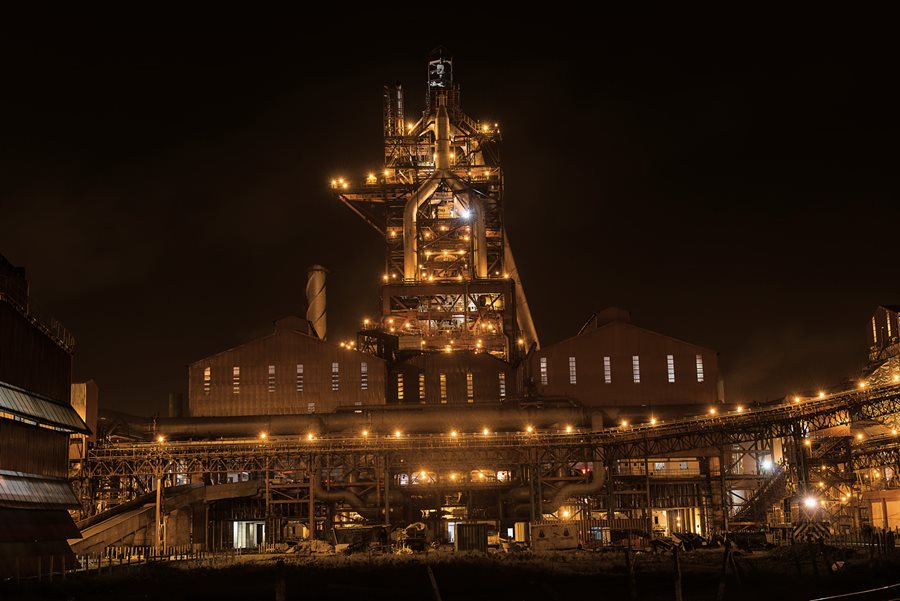
We strive to provide individuals with disabilities equal access to our website. If you would like information about this content we will be happy to work with you. Please email us at: McKinsey_Website_Accessibility@mckinsey.com
The blast furnace at Tata Steel’s Kalinganagar plant is one of the largest in India, with a capacity of 4,330 cubic meters.
Ramping up
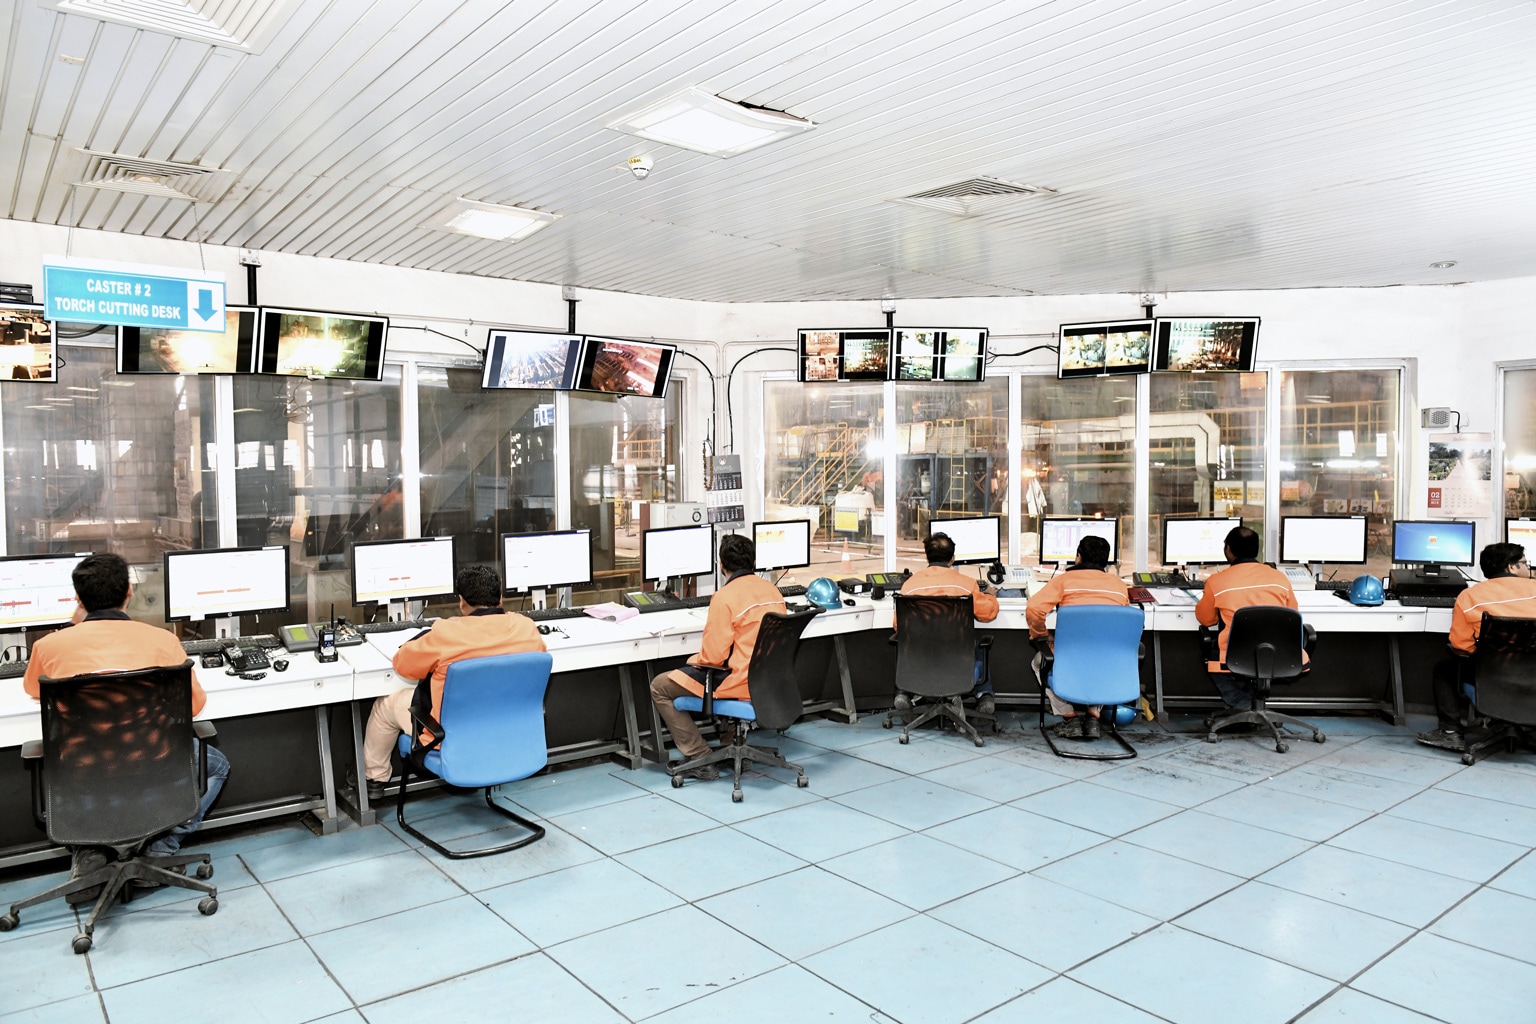
As operations teams and analytics specialists built the phase-one models, leaders at Kalinganagar sponsored an effort to begin training some 130 employees—which comprised one-quarter of the managerial staff—in analytics. With McKinsey, the plant set up an introductory analytics academy, installed a 15-member faculty, and created 50-hour curricula for five roles: digital champion, project owner, business translator, data scientist, and data engineer. Students performed simple practice exercises in line with the duties dictated by their roles.
Although the models from the first phase worked well for a time, they started to falter as conditions in the plant deviated from the conditions that the models had been optimized for. The employees who had been through the academy tried to fix the models but could not do so using the basic techniques they’d learned by that point. And they had yet to work as apprentices on analytics projects, which would have given them hands-on experience retraining models. They simply needed more real-world exposure to analytics.
Challenges also arose as frontline operators tried to start working with the models. Shailendra Rai, the chief of blast-furnace operations at Kalinganagar, recalled that operators never became comfortable with a model that had been created to help improve the stability of the blast furnace: “Most people spend 20 or 30 years learning how to operate a blast furnace. They thought that the model would be this magical solution. When the initial output from the model didn’t match their beliefs, they couldn’t understand why. They weren’t convinced it would work. The buy-in wasn’t there.”
Supporting an analytics transformation: A leader’s viewContinue to next section
by Rajiv Kumar
After the first phase of the analytics transformation at Tata Steel’s Kalinganagar plant, I saw that managers needed to put more emphasis on developing the capabilities of the plant’s workforce. I also recognized that I should make the transformation a top priority. This kind of transformation succeeds when everyone buys in—and for buy-in to develop, leaders must show they’ve bought in, too.
To signal the transformation’s importance, I announced that Kalinganagar wouldn’t undertake any other big initiatives until the plant had developed the capabilities to build and deploy analytics solutions on its own. Consistency and stability are important in steelmaking, so changing the way we do things can be hard. I knew that if everyone’s attention was divided between multiple change initiatives, the analytics transformation would be more likely to slow down or stall out.
I also began holding “skip-level meetings” with junior members of our workforce who were being trained as analytics specialists or learning to use analytics in frontline jobs. The analytics work wasn’t easy, so I wanted to hear firsthand about it, just as I do when I walk around the plant and talk to equipment operators and technicians. Having a feel for how things are going on the plant floor is important.
Then, in the second phase of the transformation, I required managers from the plant to give updates on the analytics projects they were working on. All my questions went to Tata Steel employees as well. It was another way to reinforce the idea that analytics is part of how our plant now operates.
About the Author(s)
Rajiv Kumar is vice president of operations for Tata Steel Kalinganagar.
Doubling down on capabilities
The model-building exercise confirmed what leaders at Kalinganagar had expected: that analytics could deliver significant and valuable performance improvements. It also convinced leaders to make further investments in employees’ capabilities so they could sustain the performance improvements and take analytics into other areas. In mid-2018, leaders chose to initiate a second phase of the program in which analytics specialists and frontline operators would develop and implement models to aid their decisions and receive hands-on training in analytics, with McKinsey’s help.
For the team building the superheating model, analytics specialists from Tata Steel took a refresher course in the skills they’d studied at the academy. Then they were assigned to perform certain development tasks—augmenting the user interface, simplifying the database, retraining the model, deploying new modeling techniques and approaches—in collaboration with experienced practitioners from McKinsey. By having employees work on these real-world tasks, managers were preparing them to create analytics models on their own.
Analytics specialists were assigned to perform development tasks in collaboration with experienced practitioners. By having employees work on these real-world tasks, managers were preparing them to create analytics models on their own.
Analytics specialists also spent extra time working with the employees who controlled the superheating process at the secondary-metallurgy station. They asked more questions about the process to fine-tune the model. Specialists watched the operators at work and talked with them about ways of making the model easier to use. Operators cited numerous difficulties, from faulty computer hardware to clunky user interfaces, that the analytics team helped resolve. The analytics team explained how they had developed the model and how it worked, because they wanted operators to trust its recommendations.
“All the employees at Kalinganagar had been trained to make decisions based on their experience. When problems happened, they would try to solve them with physical equations—put in raw materials and heat, get a certain output. They do look at data. But with data science, they can connect many more data points than we can with physical science. Even if they don’t have a physical equation to explain why something is happening, they can still figure it out with data. That was a new belief system that had to be built up,” said Chatterjee.
After around six months, the superheating squad had built a model capable of recommending process set points that would raise the superheating strike rate to 90 percent. Now it was time for frontline operators to begin using the model on a regular basis. Managers kept track of who used the model and who didn’t and celebrated the accomplishments of the most devoted users. Employees went from following 60 percent of the model’s recommendations to following 85 percent in a couple of months.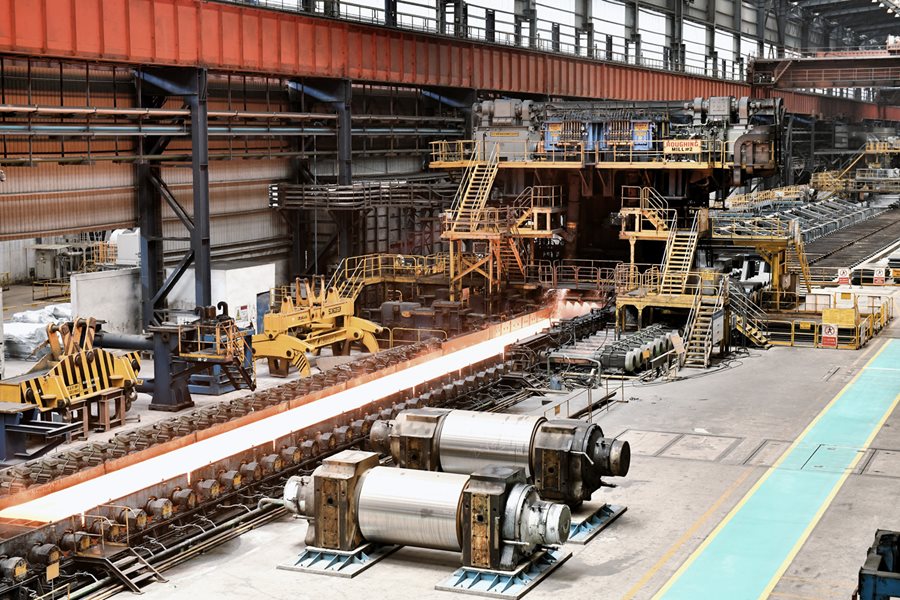
We strive to provide individuals with disabilities equal access to our website. If you would like information about this content we will be happy to work with you. Please email us at: McKinsey_Website_Accessibility@mckinsey.com
The hot strip mill makes coils of various types of steel, producing around 5.5 million tonnes per year.
Taking analytics to scale
When the second phase concluded, the plant’s leadership raised the bar once more. They called for a third phase, in which Tata Steel employees would select, lead, and deliver analytics projects related to each of the plant’s main areas: core processes, power, and utilities. McKinsey consultants would move into coaching roles on the employee-led project teams. To focus their efforts, these teams set improvement goals for more than 25 performance indicators, such as the daily tonnage of pig iron produced by the plant’s blast furnace. Because several of those indicators pertained to the superheating process, it again emerged as a priority for analytics work.
The plant’s analytics specialists had learned enough about data science by then to take charge of the superheating model. They narrowed its target temperature range. They also added the ability to predict how much cooling would take place between the secondary-metallurgy station and the casting station. This helped operators manage the transfer better and increase throughput. Frontline operators followed the model’s recommendations even more closely. As a result, the superheating model produced the annual cost savings of $4 million that had been estimated at the outset of the analytics program.
Comparable gains accrued elsewhere in the plant. For each of the 25-plus performance indicators, teams realized at least 80 percent of the targeted improvements. Their efforts yielded $70 million to $80 million of value and two to three percentage points of EBITDA1 uplift. And in July 2019, the World Economic Forum announced that an independent panel of experts in the Fourth Industrial Revolution had recognized the Kalinganagar plant’s digital achievements as leading edge and named it a Lighthouse facility—making it the first such plant in India.
Looking ahead
The Kalinganagar plant now has a cohort of more than 30 analytics specialists, including data scientists and translators. The most experienced have become in-house instructors and coaches and are responsible for helping other colleagues learn new skills in data science, business-case development, and other key domains.
With analytics models, people have become more data oriented. Instead of debating the right answer, they can dig into the data and find it, and create an analytics model to provide decision support.Shailendra Rai, head of blast-furnace operations, Tata Steel Kalinganagar
Analytics knowledge has also suffused the plant’s day-to-day work, changing the way that many employees solve problems. As Shailendra Rai, the head of blast-furnace operations, said, “If you talk to five blast furnace operators, they will have five different opinions about how to solve a problem. In a way, all five are correct—everyone’s speaking based on their own experience. But with analytics models, people have become more data oriented. Instead of debating the right answer, they can dig into the data and find it, and create an analytics model to provide decision support.”
With these capabilities, managers have drawn up a slate of more than 20 additional use cases, and they are reinforcing the use of analytics where it’s already in place. For Tata Steel’s Kalinganagar plant, analytics has become more than a tool for answering questions—it’s an integral part of the plant’s operations and culture.
No comments:
Post a Comment