


Summary
In September 2020, President Xi Jinping announced new goals for China to reach carbon neutrality before 2060, as well as to strengthen its existing 2030 commitments under the Paris Agreement. With these announcements, China has signaled a move to join the European Union—as well as the United States under a Biden administration—in leading long-term climate action among the big emitters.
Our analysis demonstrates that if China’s new long-term goal covers all greenhouse gas (GHG) emissions, and not just carbon dioxide (CO₂), this could bring the country within reach of the emissions reductions required by mid-century for its actions to be in line with the Paris Agreement’s long-term goal of limiting average global temperature increases to 1.5°C. However, if President Xi’s announcement is only meant to cover CO₂, then China would need to achieve carbon neutrality around 2050 for this to be compatible with the Paris Agreement.1
Either way, China’s short-term actions will also need to be quickly brought into line with its new long-term trajectory. This includes doing more than simply peaking CO₂ emissions before 2030 as President Xi foreshadowed. Instead, our analysis demonstrates that China would need to peak its emissions by 2025 and rapidly reduce these thereafter to be compatible with the Paris Agreement. This also implies a need for significant adjustments to the other quantifiable targets identified in China’s existing Nationally Determined Contribution (NDC) under the Paris Agreement and the ramping up of action to achieve these. Reducing coal-fired power generation quickly and phasing it out entirely by 2040 would be an important step toward achieving this early peak and rapid reductions.
Under the Trump administration, the United States has reneged on past climate action promises and rolled back existing policies resulting in an increase in emissions compared with the Obama administration. As a result, this report highlights that even under a Biden administration, the United States is likely to miss its previous 2025 target under the Paris Agreement.
However, a Biden administration means that the United States now has the potential to reverse the Trump administration’s rollbacks and make a significant contribution to closing the Paris Agreement’s ambition gap in a new 2030 NDC. Indeed, by taking the initiative to reboot U.S. action in line with the Energy and Climate Package touted by President-elect Biden during his campaign, including its goal to reach net-zero emissions by 2050, U.S. emissions could be reduced substantially by 2030.2 For example, our analysis indicates that if the Biden campaign’s policies were to be fully implemented with the support of Congress (see below), and continue to be supported by strong subnational action, they could bridge more than half of the U.S. share of the global ambition gap by 2030 through reducing emissions by up to 38%–54% below 2005 levels (GHGs, including land use, land-use change and forestry)3. This would also reduce estimates for average global temperature increases in 2100 by 0.1°C, on top of the 0.2°C–0.3°C reduction achieved by China’s recent announcement.
As this report shows, President-elect Biden’s plan to decarbonize the U.S. electricity system by 2035 would represent by far the biggest contribution to this effort and is in line with the Paris Agreement temperature goal. It would result in savings of ~1,350 MtCO₂ out of a total abatement potential of ~1,810 MtCO₂e [1,630–2,100] in 2030 across his Energy and Climate Package.
However, this report also estimates that potentially only half of this potential could still be achieved through Executive Authority in the event of Congress not supporting action, although this estimate carries a large degree of uncertainty. We also outline how additional emissions reductions could come from action in other areas, including freight transport and industry—with the electrification of end-use sectors and green hydrogen important opportunities to achieve this.
If the United States and China fully implement these ambitious goals and are able to achieve net-zero GHG emissions around mid-century, it would be a monumental step forward toward bringing the Paris Agreement goals within reach. It would also mean that for the first time more than 60% of the world’s emissions are in countries with a clear pathway to decarbonize their economies. However, achieving the goals will require bold action in all sectors of the economy, with an early coal phaseout being paramount for both countries.
Introduction
By ratifying the Paris Agreement, the world’s nations have committed to the agreement’s long-term goal of holding the increase in global average temperature to well below 2°C and pursuing efforts to limit it to 1.5°C. This requires a rapid peaking, followed by a 45% reduction in global GHG emissions by 2030 compared with 2010 levels, and reaching net-zero carbon emissions around the middle of the century (IPCC 2018; Schaeffer et al. 2019). Governments also agreed in Paris to ratchet up their climate targets, or NDCs, every five years. Collectively, these targets are still inadequate to achieve the Paris Agreement goal, resulting in estimated warming of ~2.7°C by the end of the century (Climate Action Tracker 2020d).
Governments were required to submit the first round of these updates by 2020 in preparation for the UN’s COP26 Climate Conference, but COVID-19 has delayed progress in many countries and the conference itself has been delayed until late 2021.
Since 2015, emissions have kept rising and are expected to continue to increase once full economic activity resumes in 2021 or 2022. This stands in stark contrast to the unequivocal call for drastic and rapid reductions spelled out in recent reports by the Intergovernmental Panel on Climate Change (IPCC) (Intergovernmental Panel on Climate Change (IPCC) 2014; IPCC 2018).
The United States and China are the world’s largest GHG emitters; between them, they are responsible for almost 40% of global GHG emissions. Leadership from both countries, along with the EU, would be a major boost for international climate action.
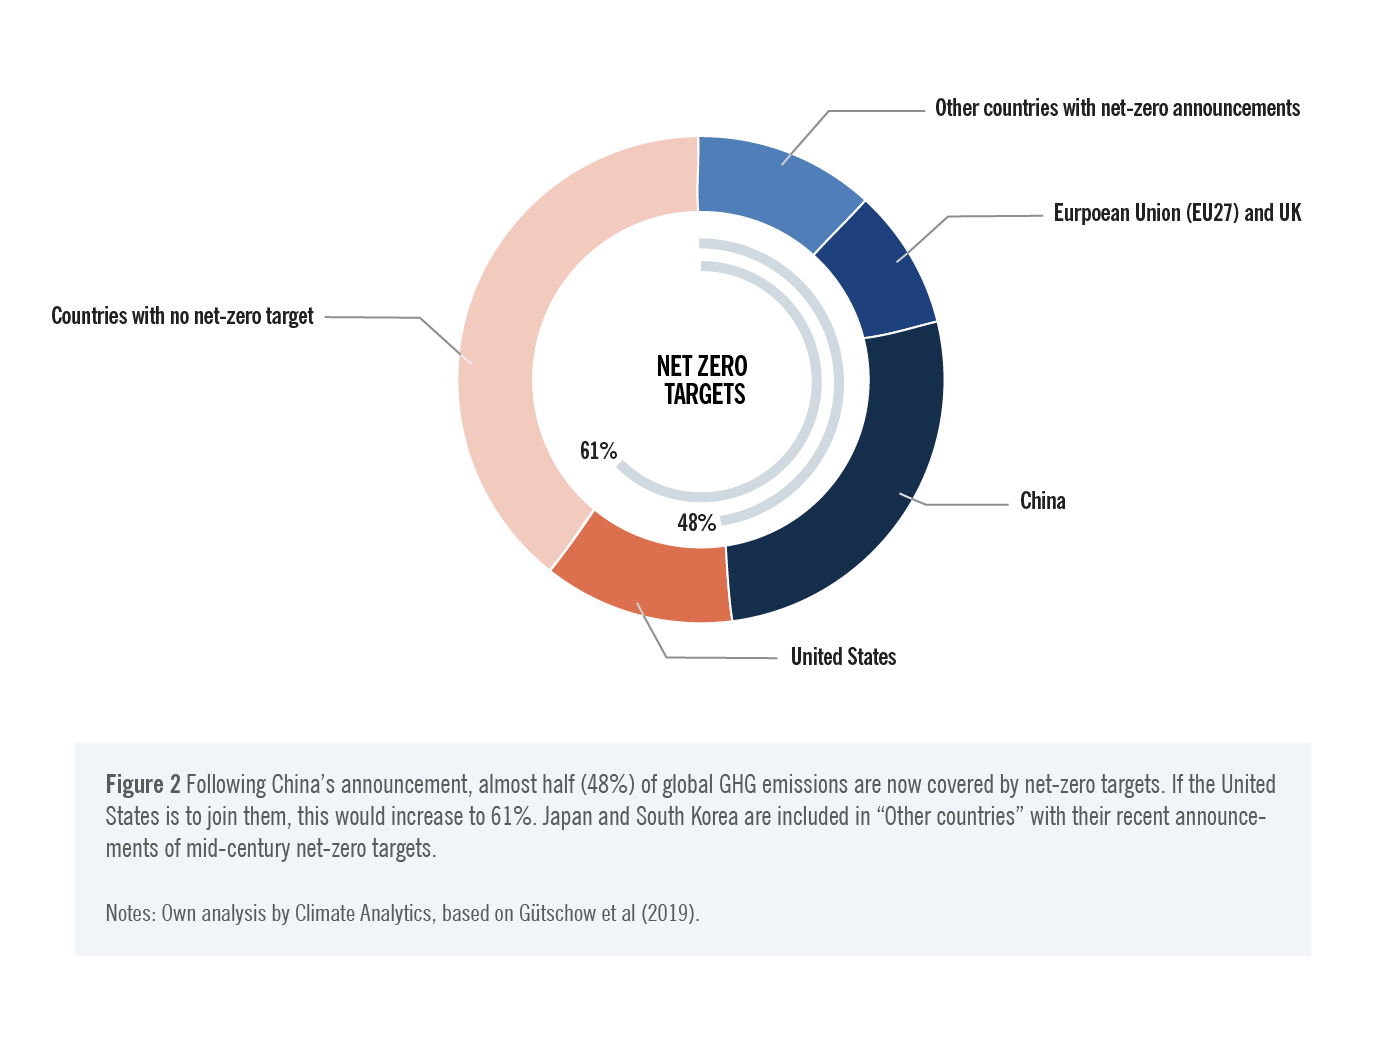
In September 2020, China announced that it would enhance its NDC target, aiming to peak carbon emissions before 2030, as well as a new target of achieving carbon neutrality by 2060.4 With this step, China is joining ranks with the EU, which already has a net-zero GHG by 2050 target and is discussing an enhanced NDC for 2030. The announcement is a true milestone and, following similar commitments by Japan and Korea in the weeks that followed, it means that just under half of all GHG emissions globally are now covered by net-zero emissions targets (Figure 2).
If China’s carbon neutrality goal covers all GHG emissions, rather than just CO₂, it would be within reach of emissions levels consistent with the Paris Agreement’s long-term temperature goal.
The news from China followed closely on the European Commission proposal to increase the 2030 NDC target from the current at least 40% to at least 55% GHG reduction from 1990 levels to bring it in line with the 2050 GHG neutrality goal endorsed by the EU member states in 2019.5 The European Parliament has suggested a 60% reduction. The EU is expected to enshrine this increased 2030 target in its revised NDC by late 2020, in line with the Paris Agreement’s “ratchet up” mechanism.
The United States formally left the Paris Agreement on November 4, 2020. President-elect Biden has vowed to begin the process of re-joining the Paris Agreement on his first day in office in January 2021. This promise echoes increased awareness by the U.S. public of the dangers of climate change with 2020 dominated by out of control heat and wildfires in the country’s Southwest and powerful storms in the East. However, it would likely take until at least the third quarter of 2021 for the United States to formally submit a new NDC, even though there are options to clarify the administration’s intended strategy in the interim (Biniaz 2002).
During the election campaign, Biden published a proposed policy platform on energy and climate, including a Climate Plan. This contains a target “ensuring the U.S. achieves a 100% clean energy economy and net-zero emissions no later than 2050.”6 Such a target would increase the share of global emissions covered by net-zero targets to 61% (see Figure 2). If the United States, China, and the EU update their NDCs with substantially increased ambitions for 2030, it will send a very strong signal to other countries to enhance their 2030 NDC emissions targets to bring them into line with the Paris Agreement goals.
Current Targets & Projections
Summary
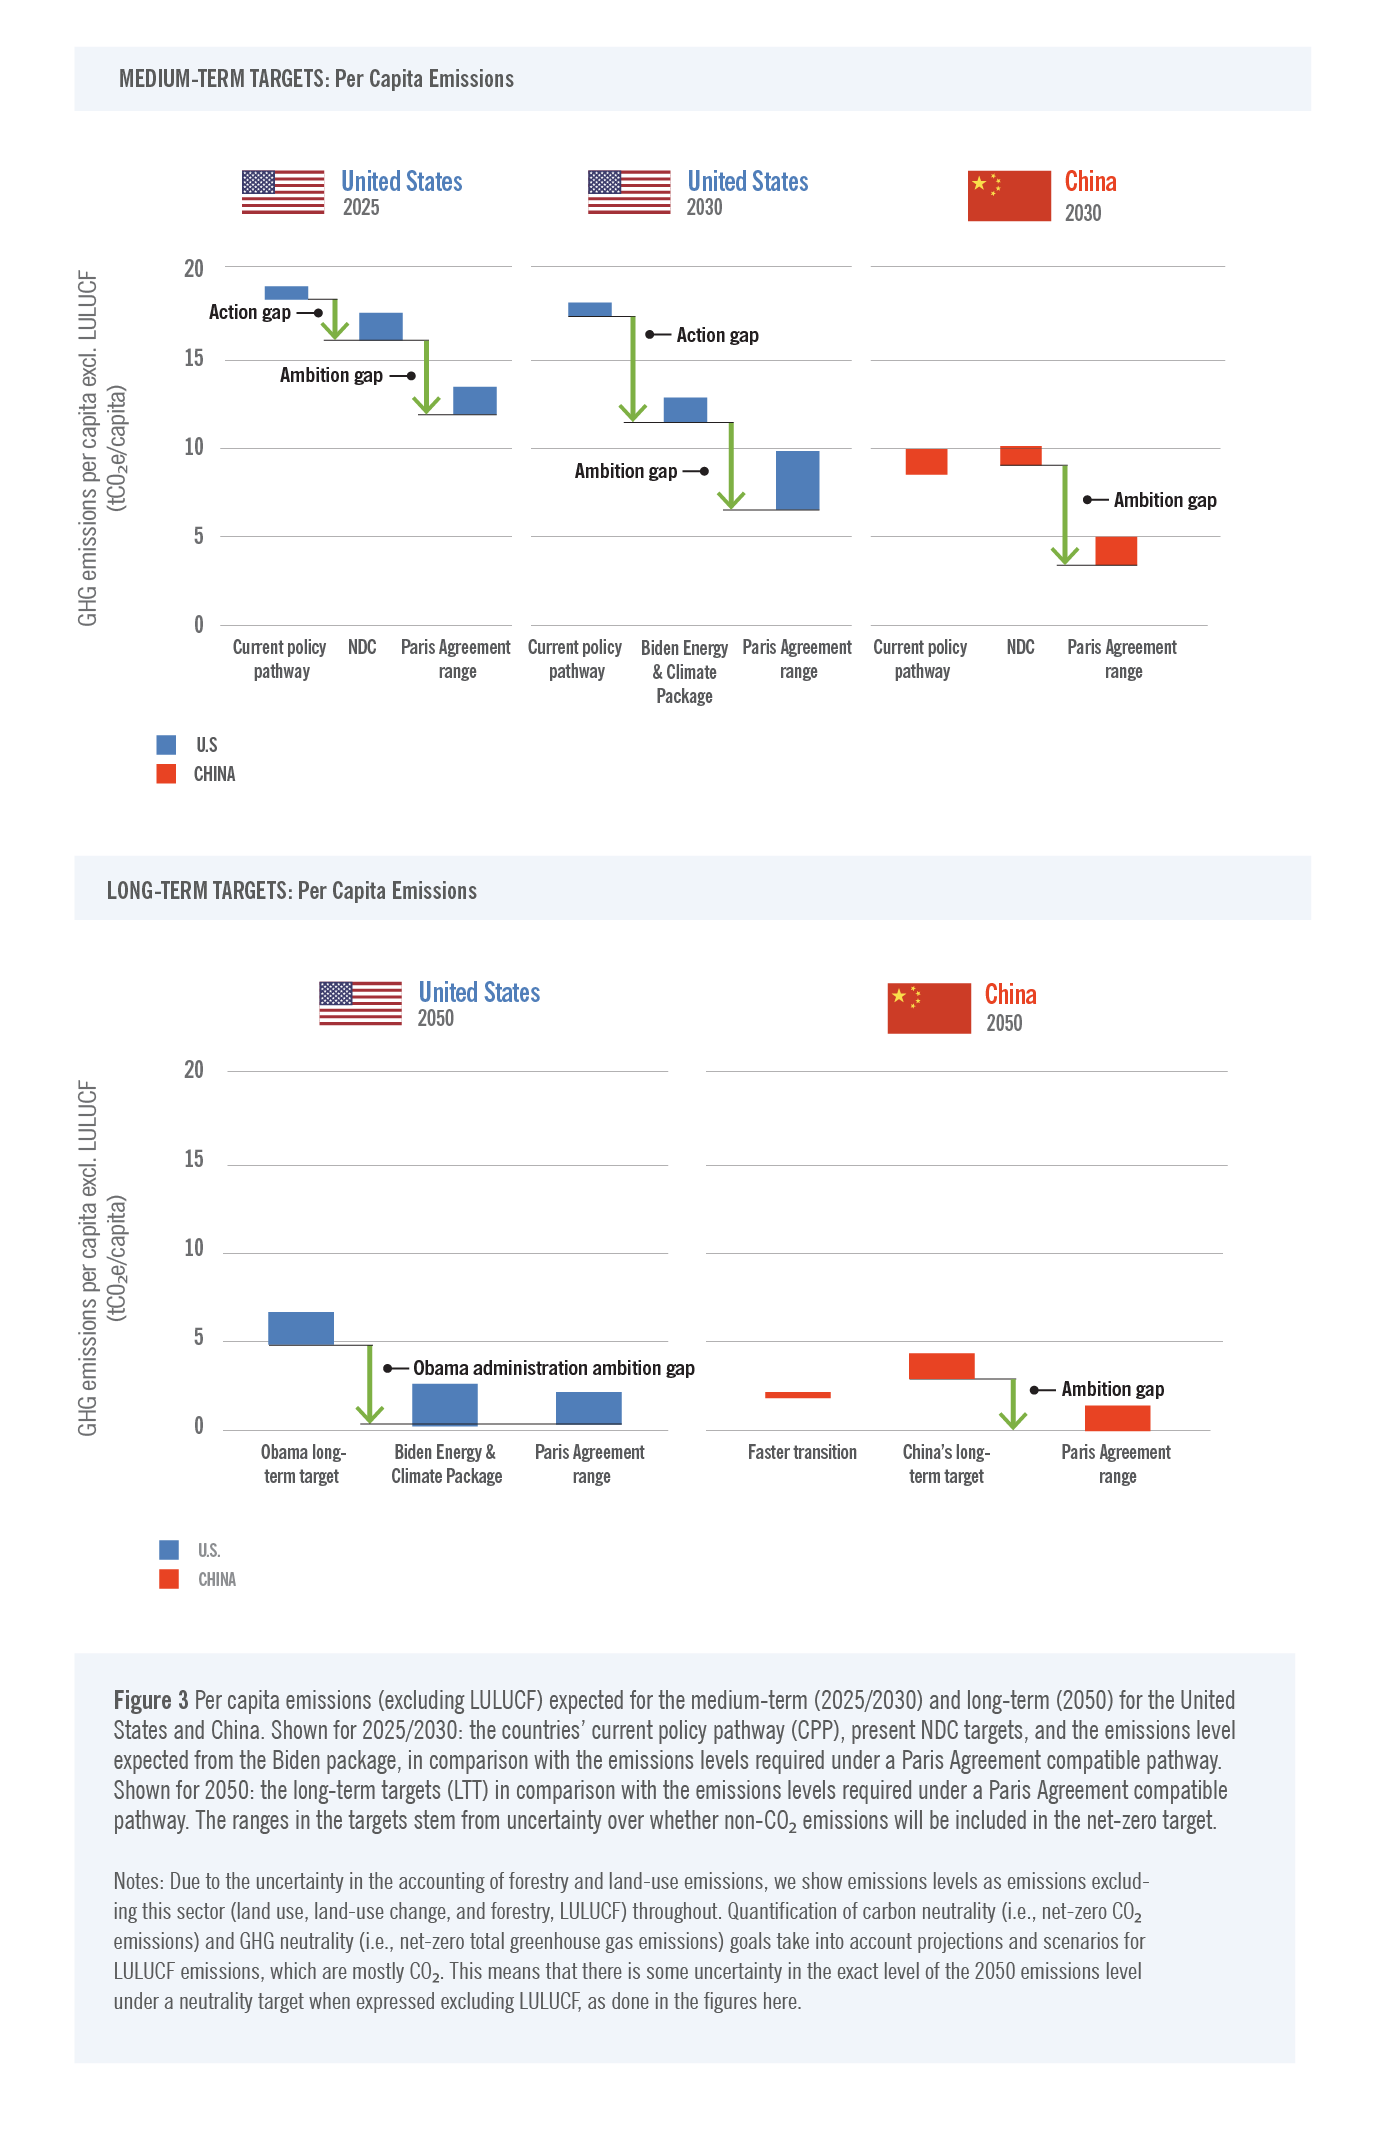
The climate targets and policies of the U.S. and China show ambition and action gaps (see Figure 3). The “ambition gaps,” that is, the gaps between target emissions levels and Paris Agreement compatible emissions levels, are closing for the long term but still loom large for the shorter-term NDC targets. There are also still “action gaps,” that is, gaps between targeted emissions levels and the emissions expected to be achieved with current policies, especially for the United States.
Short-term targets (Nationally Determined Contributions)
Both governments have previously submitted Nationally Determined Contributions (NDCs) under the Paris Agreement.
The U.S. NDC, submitted by the Obama administration, contained an absolute target of decreasing net greenhouse gas emissions (including land use) 26%–28% below 2005 levels by 2025. The Trump administration’s withdrawal from the Paris Agreement means this NDC no longer applies; however, it had already been effectively shelved since the administration announced its intention to withdraw from the agreement in 2017. Numerous policies intended to help achieve the target have also been rolled back in recent years, and the United States is not on track to achieving the target originally outlined in that NDC.
China’s NDC does not contain an absolute emissions target but instead commits to peaking its still growing carbon dioxide emissions by 2030 at the latest, committing to efforts to peak these earlier, and reducing the carbon intensity of its GDP by 60%–65% by 2030 versus 2005. It also contains specific targets on the non–fossil fuel share in total primary energy supply to around 20% by 2030 and an increase in forest stock volume. Table 1 shows how these targets translate to emissions based, in the case of China, on assumptions of GDP development and of peaking in 2030, and projections for other greenhouse gases.7 An earlier peak, as the Chinese government hopes to achieve, as well as a revised NDC, would improve on these values.

Long-term targets (mid-century)
Under the Paris Agreement, governments were also invited to submit long-term low-carbon development strategies. Paris Agreement compatible global emission pathways require CO₂ emissions to reach net-zero by close to 2050 [2045–2055] and total GHG emissions to reach net-zero close to 2070 [2065–2080] (IPCC 2018). Different terms have been used to describe this, including “carbon neutrality” (for CO₂) and “GHG neutrality” or “climate neutrality” for all GHG emissions. Reaching net-zero CO₂ or net-zero GHG emissions before these dates would have the benefit of halting warming earlier and significantly reducing the total twenty-first-century requirement for carbon dioxide uptake in forests and soils and/or negative CO₂ emissions via technological means. When emissions reach net-zero, the increase in warming should stop shortly afterward. This has led to a push to adopt net-zero GHG emissions targets by or before 2050, in particular for large emitters/G20 countries.8
The United States submitted a strategy under the Obama administration that aimed for an 80% GHG emissions reduction on 2005 levels by 2050, although this strategy was removed from all U.S. government websites once the Trump administration took office. President-elect Biden’s Energy and Climate Package contains a stronger target of reaching net-zero emissions by 2050.9 echoing the scientific case for net-zero emissions by mid-century. China has not yet submitted a strategy but has announced a long-term target; it is expected that China will submit a strategy shortly in line with its commitment at the G20.
In September 2020, China announced that it “aim[s] to have CO₂ emissions peak before 2030 and achieve carbon neutrality before 2060” (H.E. Xi Jinping 2020). The question of whether this is meant as a GHG neutrality target or a carbon neutrality target is still under active discussion and analysis, according to recent reports and based on work by Tsinghua University.10
If interpreted as carbon neutrality, this target leads to around 2,050 MtCO₂e [1,830–2,260] for 2060 for all GHG emissions excluding land use, land-use change, and forestry (LULUCF), assuming that fully phasing out non-CO₂ gases will take until 2080. Depending on the path to this 2060 point, we could see an emissions level of 5,670 MtCO₂e [4,960–6,400] by 2050 (excluding LULUCF), contingent on the speed at which non-CO₂ emissions, for example, methane from the energy industry and agriculture, are reduced.
If China’s target is interpreted as covering all GHGs, residual emissions excluding LULUCF are estimated at around 600 MtCO₂e in 2060, assuming a LULUCF sink of around this magnitude. Emissions levels in 2050 would then be estimated at around 4,670 MtCO₂e [4,070–5,300].
The “action gap” between expected emissions and targets
Are the United States and China on track to meeting their targets?
Figure 4 shows the expected future emissions for the United States and China given their current policy landscape. We expect a significant decrease of 10%–11% for 2020 in the United States due to the COVID-19 crisis, and a smaller decrease or even a slight increase in China for 2020 due to earlier recovery. Emissions are likely going to rise again with the expected economic recovery and are expected to reach pre-pandemic levels by 2030, in the absence of additional policies including green recovery packages.
However, both countries would have to increase their decarbonization efforts after 2030 to achieve their long-term targets if they only achieved emissions reductions set out in their NDCs: if China can bring forward its peaking year from 2030 to 2025, it would reduce the rate of decarbonization needed after 2030.

The “ambition gap” between targets and Paris Agreement compatible levels
Is meeting the targets sufficient for bringing us to climate safety; that is, are the targets and the Paris Agreement compatible?
Emissions pathways consistent with meeting the Paris Agreement long-term temperature goal and limiting warming to 1.5°C or below require:
a peak in global emissions as soon as possible, followed by;
a reduction of at least 45% below 2010 levels by 2030 on average across all nations;
reaching carbon neutrality, that is, net-zero CO₂ emissions by around 2050; and
GHG neutrality by around 2070.
Within this emissions envelope, countries that are still increasing their emissions due to strong economic development can reach these milestones later, while fully industrialized nations can and need to reach these goals earlier.
Recognizing that developed countries would need to reduce their emissions faster than the global average, the EU is in the process of increasing its NDC target from at least 40% to at least 55% and possibly 60% emissions reduction below 1990 levels11 by 2030. This will be equivalent to a 46%–52% reduction below 2010 levels and is intended to bring the EU onto a pathway toward its goal to achieve climate neutrality (greenhouse gas neutrality) by 2050.
How do the U.S. and China targets compare with the Paris Agreement temperature goal?
In Figure 1 (see Summary), we compared expected emissions in both countries with expected levels under different temperature scenarios, shown in colored ranges. Each colored band indicates the domestic emissions range consistent with the global emissions profile that would result in the indicated long-term temperature rise. We derived the bands from global least-cost pathways developed with integrated assessment models (Gidden et al. 2019; IPCC 2018; Huppmann et al. 2019).
The comparison in Figure 1 shows that although China is on track to achieving its NDC target, that target is far above the domestic emissions level required under a 1.5°C Paris Agreement compatible pathway. China would need to reduce emissions to a level of 5.2–7.3 GtCO₂e (excluding LULUCF) in 2030 and peak emissions as soon as possible to be Paris Agreement compatible.12 Based on current GDP projections, this would correspond to an 87%–93% carbon intensity target, up from the current 60%–65% for 2030.
If the long-term target of carbon neutrality before 2060 were to cover all GHG emissions, it could be aligned with the 1.5°C Paris Agreement compatible pathway range if it were to be achieved on a fast transition pathway, peaking emissions early, and with steep reductions by 2030. We discuss the importance of the shape of the path to net-zero for China in more detail in the section on China below.
The U.S. domestic emissions at the lower end of its previous 2025 NDC, and in line with the Obama administration’s long-term target, would have achieved a 2°C compatible level of domestic emissions reductions, but the upper end is more consistent with a 3°C warmer world. The United States would need to strengthen its NDC to reduce domestic emissions further to between 2.3 and 3.4 GtCO₂e (excluding LULUCF) in 2030 to immediately bring the country onto a 1.5°C compatible pathway.13
The net-zero emissions target for 2050 formulated in President-elect Biden’s Energy and Climate Package could achieve a Paris Agreement compatible 1.5°C pathway for domestic emissions, especially if interpreted as covering all GHG emissions.14
China
Paris Agreement Compatible Pathways
The global modeling community has translated the Paris Agreement long-term temperature goal into global emissions pathways, showing a range of possible futures consistent with this goal. Global least-cost pathways show how the global emissions pathways would be differentiated between regions and countries, taking into account historical emissions and energy mix, development needs, and technical and economic ability to decarbonize.
Figure 5 shows the resulting Paris Agreement compatible domestic emissions pathway range for China, highlighting one scenario, which we use to extract marker benchmarks below.15,16 It shows that total GHG emissions (excluding LULUCF) need to be net-zero between 2065 and 2070 with some scenarios crossing the zero line before 2055. Including LULUCF, GHG emissions would need to reach net-zero around 2060. The recently announced 2060 target could be aligned with this Paris Agreement benchmark if it holds for all GHG emissions sources and sinks and if the trajectory of emissions between now and 2060 is sufficiently steep. Reducing all GHG emissions will require additional policy action on agriculture, fugitive emissions from energy industry, as well as industrial processes and product use and waste.
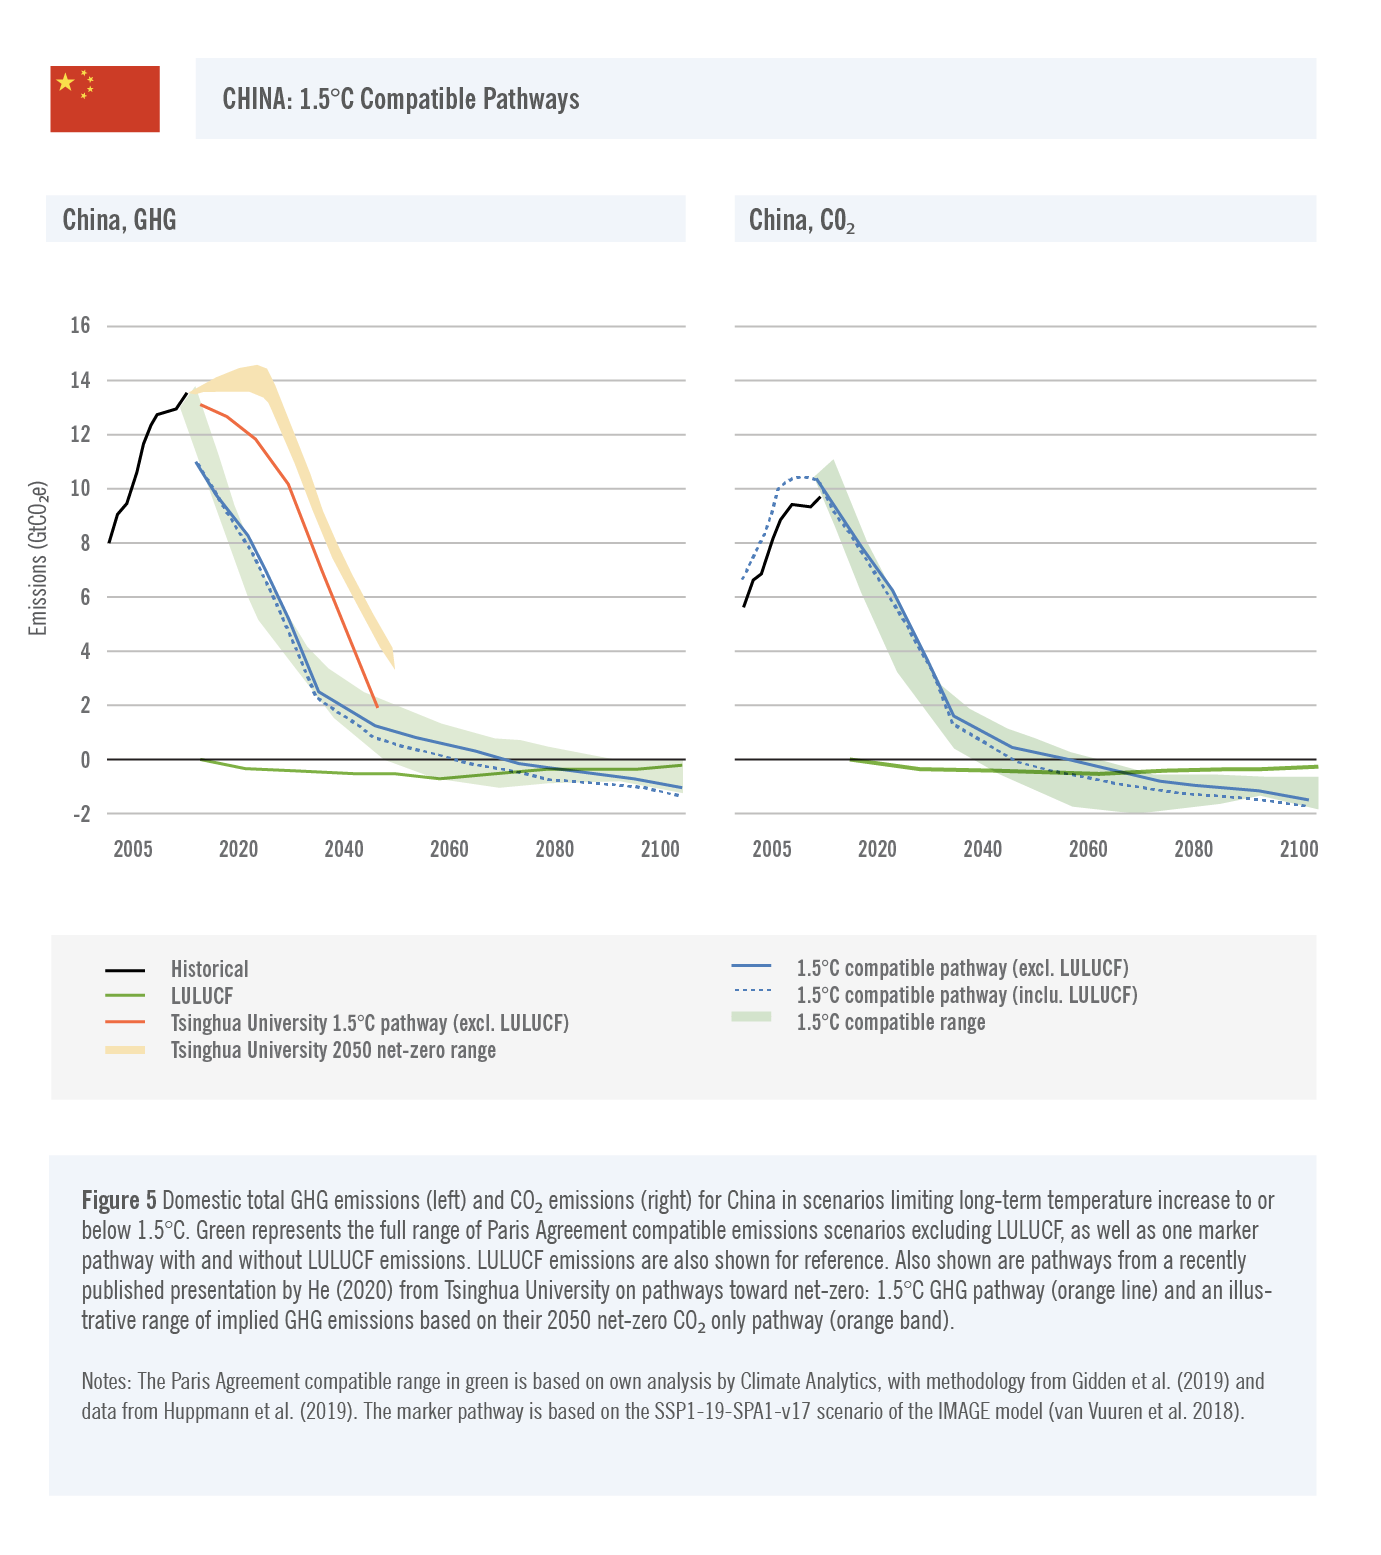
For China, it is also important to look at the CO₂ portion of these scenarios as its NDC is defined in terms of CO₂. Figure 5 shows that CO₂ emissions excluding LULUCF would need to reach net-zero in 2060 in line with the Paris Agreement. When LULUCF emissions are included, carbon emissions would need to reach net-zero much earlier, by around 2050. After the net-zero year, emissions need to become negative, that is, China would need to remove more CO₂ than it emits.
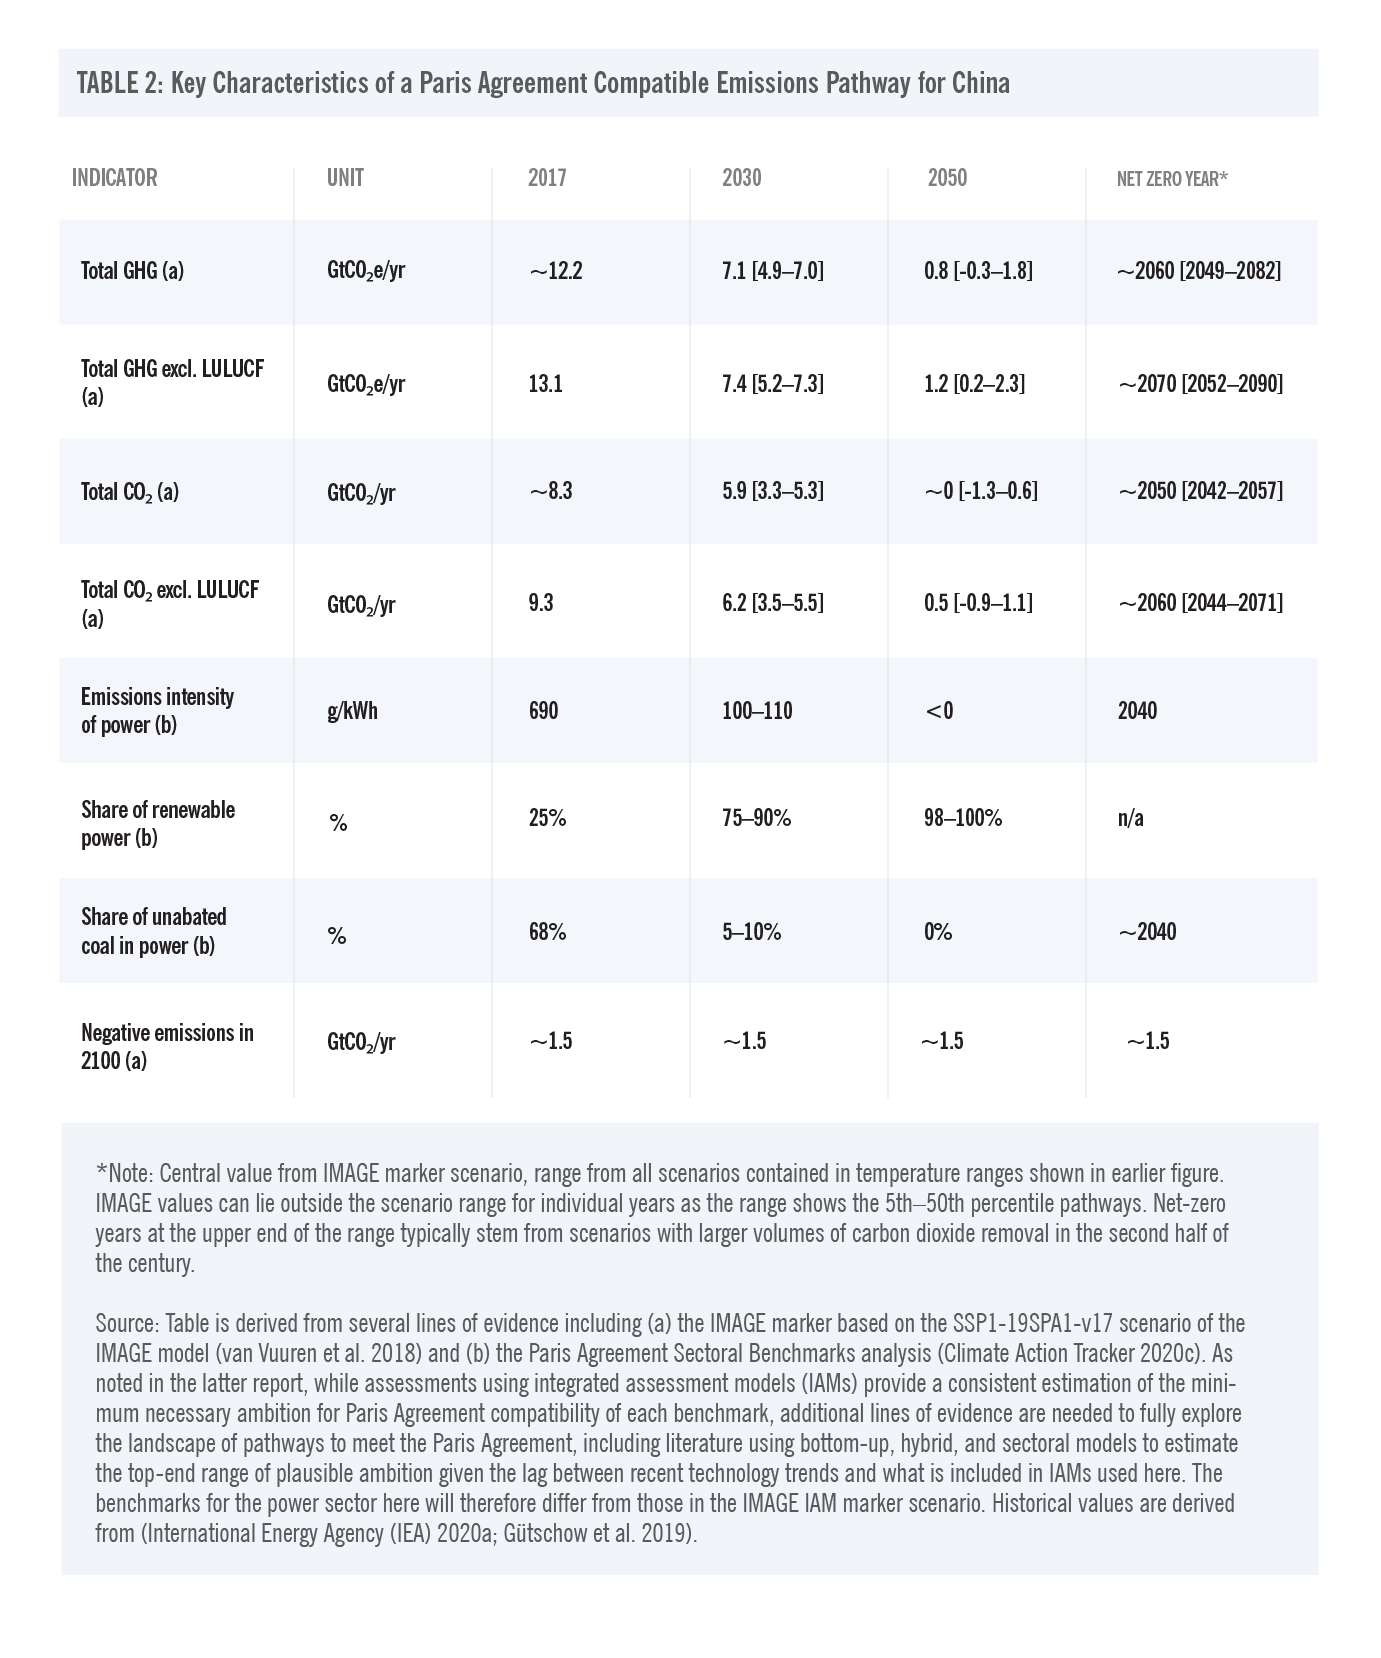
In the Paris Agreement marker pathway for China shown above, total GHG emissions excluding LULUCF in 2030 would need to be close to 5.2–7.3 GtCO₂e.17 Based on current GDP projections (Climate Action Tracker 2020a), this would correspond to an 87%–93% carbon intensity target, up from the current 60%–65% for 2030. Strengthening China’s NDC according to these values would bring its domestic emissions in line with the latest scientific understanding of the implications of the Paris Agreement temperature goal.
This pathway requires significant negative emissions by the end of the century of up to 1.5 GtCO₂e. The earlier peaking emissions and decarbonization can be achieved, the less reliant China will be on carbon dioxide removal and reaching net negative emissions later on in the century. It also illustrates again that the pathway of emissions reductions is critical to understanding whether a specific long-term goal is Paris Agreement compatible. Whether the Chinese 2060 goal is consistent with a 1.5°C world depends critically on the path taken to achieve it.
A recent study by Tsinghua University laid out possible pathways, the most ambitious of which is shown in Figure 5 (He 2020). Even though this scenario sees emissions reaching the 2060 net-zero point and decreasing immediately, meaning they would peak this year, it still results in significantly higher cumulative emissions and thus will imply a larger temperature rise. Additional efforts would be required either before 2050 to reduce emissions even faster or after 2050 with even larger negative emissions to contribute to limiting warming to or below 1.5°C.
The net-zero emissions point will not be reached at the same time in all sectors. Because the power sector’s transition is most advanced and is a catalyst for decarbonizing other sectors, it should decarbonize most rapidly, reaching zero around 2040 in China and contributing increasingly negative emissions thereafter, enabled by increasing uptake of biomass for power generation with carbon capture and storage (BECCS). China has already decreased its power emissions intensity from 1,100 to 750 gCO₂/kWh from 1990–2017, representing an annual average decrease of almost 1.5%. For Paris Agreement compatible decarbonization, this emissions intensity should decrease to 100–110 gCO₂/kWh in 2030 and 0–5 gCO₂/kWh by 2040 with negative emissions required thereafter (Climate Action Tracker 2020c). This would imply a tenfold increase in the annual decarbonization rate to more than 20%.18
To achieve these reductions in emissions intensity, deployment of renewable energy technologies needs to be accelerated, and unabated use of fossil fuels, in particular coal, needs to be phased out.
Although China is deploying renewable power sources at a significant rate, its continued construction of coal plants is at odds with the necessary power sector decarbonization. Rather than adding unabated coal capacity19, a Paris Agreement–aligned emissions pathway will require a fast reduction of emissions from coal-fired power generation to a share of 5%–10% of power generation by 2030 and a phaseout of all unabated20 coal plants by 2040 at the latest, meaning that utilization rates would need to be reduced, and/or a large part of the current coal capacity in particular any new coal capacity being brought online today would be unlikely to run for its full technical lifetime (Yanguas-Parra et al. 2019; Cui et al. 2020).
This holds even truer for unabated21 gas built after 2020, which would have to be phased out again within one to two decades. Any unabated22 gas in 1.5°C compatible scenarios for China would need to be offset by negative emissions technology from 2040.
Other zero or low-carbon emissions technologies deployed in pathways to achieve the reduction in emissions intensity are nuclear energy and the use of CCS with fossil fuels (coal or gas).
CCS is currently not a commercially viable option in the power sector, and there is no fossil fuel–fired power generation with large-scale carbon capture and storage in operation or in construction in China. Three large-scale CCS projects are in the early development phase, but at least one of them will use the CO₂ for enhanced oil recovery, rather than long-term storage (Global CCS Institute 2020). None of these is expected to come online before the middle of the century.
We, therefore, consider benchmarks for the phaseout of coal and gas based on the assessment that it is very unlikely that coal and gas with CCS will be able to compete with renewable energy and advance storage.
Nuclear power currently has a 4% share in China’s electricity supply (2017 value). Some decarbonization pathways show an increasing role, others a constant or decreasing role for this technology. The uncertainty in the potential for scaling up this technology, the high cost in comparison with renewable energy, and the steadily improving prospects for integration of high shares of renewable energy, for example, through coupling with storage, make 100% renewable electricity globally and in China a realistic prospect (Burandt et al. 2019).
Based on the assessment that it is unlikely that fossil fuels with CCS or nuclear energy will be able to compete with renewable energy, the following benchmarks for the share of renewable energy of power for China have been derived from pathways for China that achieve the Paris Agreement temperature goal: a 75%–90% share of renewable power in 2030, 95% by 2040, and 100% by 2050 (Climate Action Tracker 2020c; Yanguas-Parra et al. 2019).
Table 2 summarizes the key characteristics of the Paris Agreement compatible pathway of Figure 5 for China.
An early peak in emissions and efforts to phase out coal-fired power generation will facilitate achievement of all these benchmarks. If emissions were to steadily decline from 2021 onward, GHG neutrality could be reached by 2060 by decarbonizing at a rate of ~3% per year, a rate of decarbonization that few countries have achieved so far. If emissions were to increase again after 2020 or plateau and only start to decrease as late as 2030, the subsequent annual decarbonization rate would have to be closer to 5% (assuming the same percentage reduction year on year).23
Opportunities for action to close the gap
China can take a few key steps to peak emissions as soon as possible and the required subsequent rapid decarbonization rates.
The single most important step is phasing out coal from power generation by 2040 at the latest, including early and fast reductions to reduce the share to 5%–10% in 2030. Any additional coal built today will result in stranded assets toward 2040 (Yanguas-Parra et al. 2019).
With an accelerated uptake of renewable energy, and avoiding investment in additional fossil fuel infrastructure that would lead to an increased risk of stranded assets, the power sector can be decarbonized by 2040.
In the energy-using sectors, especially transport, decarbonization can be achieved through energy efficiency and electrification. In addition, green hydrogen can achieve “indirect” electrification of freight transport and in the industrial subsectors, which are harder to decarbonize, by converting renewable electricity to hydrogen fuel.
Sector-specific decarbonization roadmaps can be developed on the basis of an in-depth analysis of sectoral and economy-wide pathways. These can help to channel investments toward clean technology as part of the COVID-19 recovery.
The preparation of the 14th Five Year Plan for 2020–2025 appears to be the right moment for China to plan to bring its emissions increase to a halt and prepare the way for rapid reductions after mid-decade (Yu et al. 2020).
United States
Paris Agreement compatible pathways
Similarly to China, the U.S. domestic emissions pathway under a Paris Agreement aligned scenario would see drastic reductions from now until the middle of the century, with net-zero GHG achieved by 2065 when taking into account the land sector, with the most stringent pathways achieving this goal before 2055. Carbon emissions would reach net-zero earlier, around 2040.
In our Paris Agreement compatible marker pathway for the United States (Figure 6) this transition is enabled by a fully decarbonized power sector by 2035, which is achieved through a complete coal phaseout before 2030 and unabated gas mostly shut down by 2040. Biomass with carbon capture and storage enables negative emissions from 2030 onward and continuing for the rest of the century.
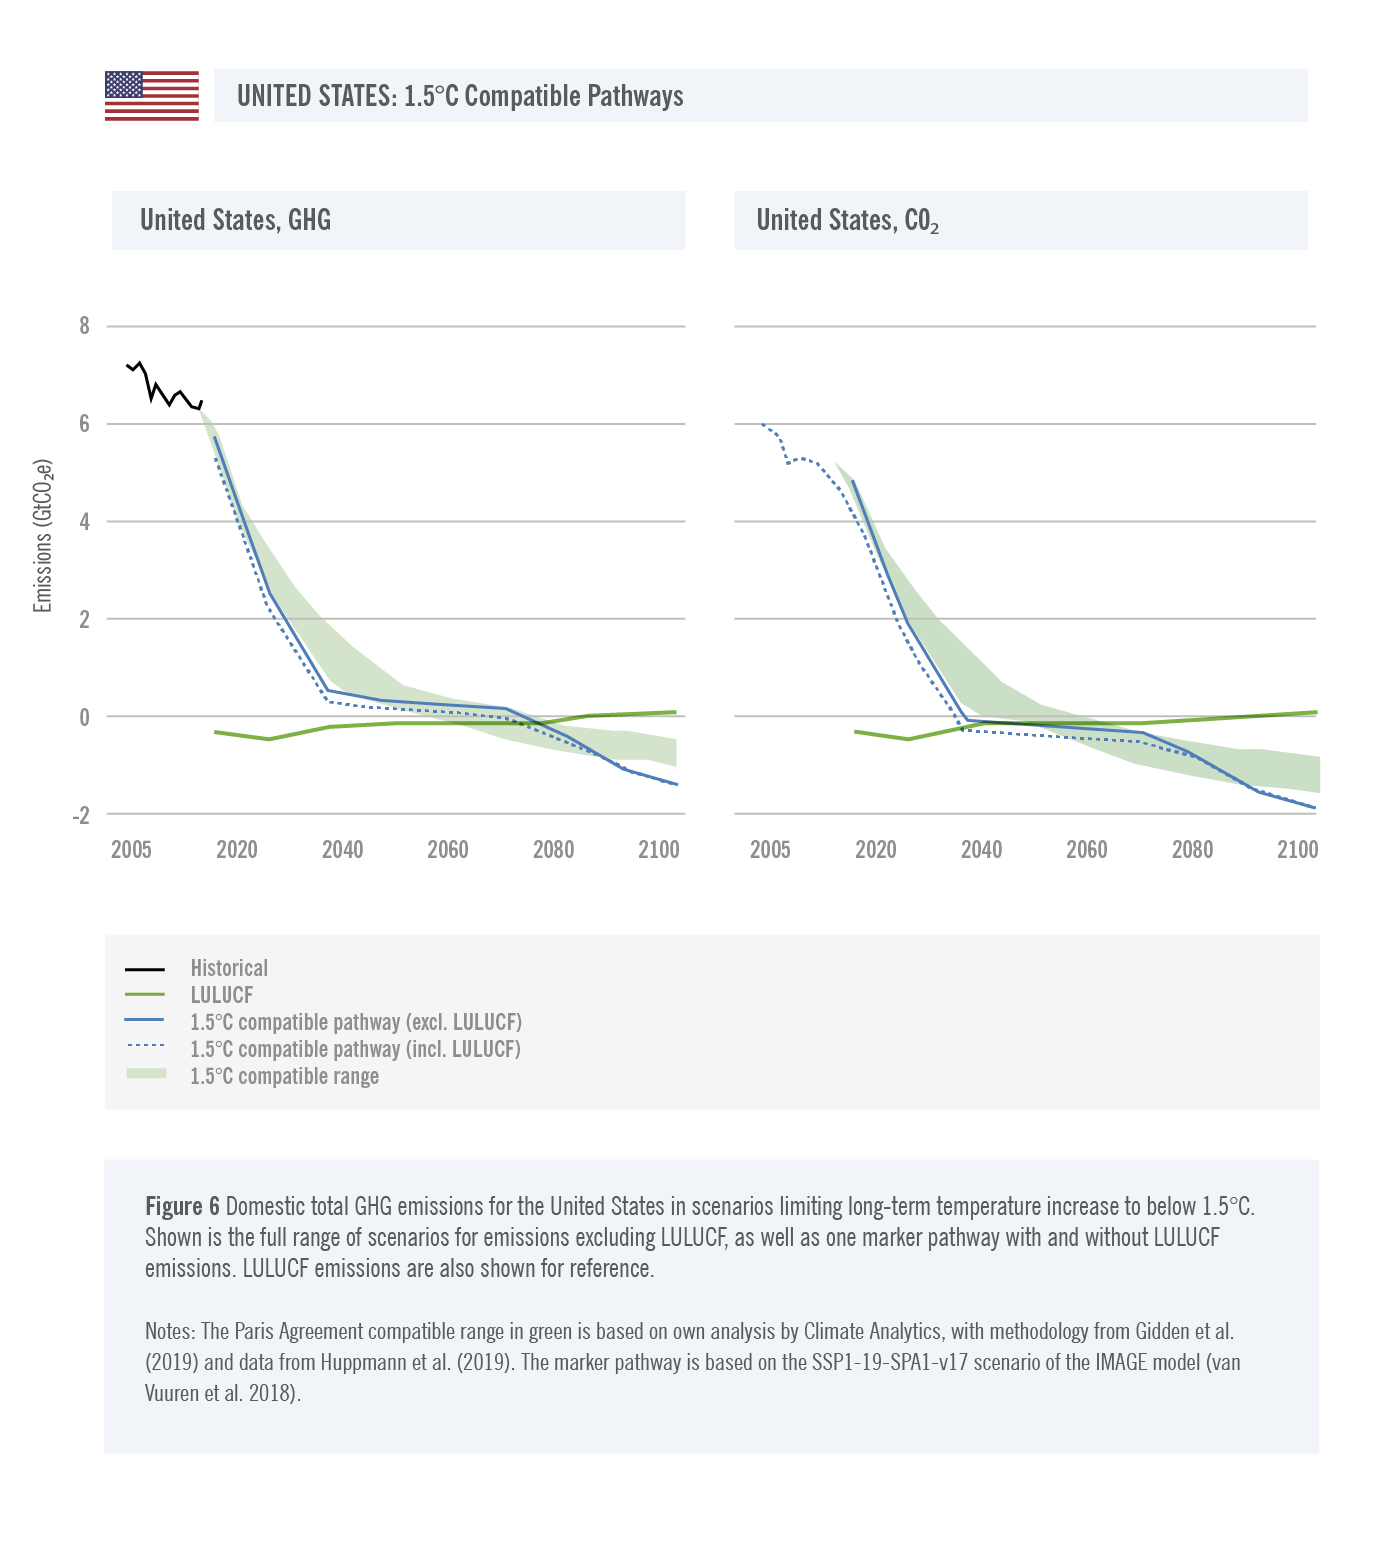
To comply with a 1.5°C pathway, 2030 emissions levels would need to reduce to 2.3–3.4 GtCO₂e (excluding LULUCF) and 1.4–2.5 GtCO₂e when including LULUCF.24
Table 3 shows key characteristics of the Paris Agreement compatible pathway of Figure 6 for the United States.
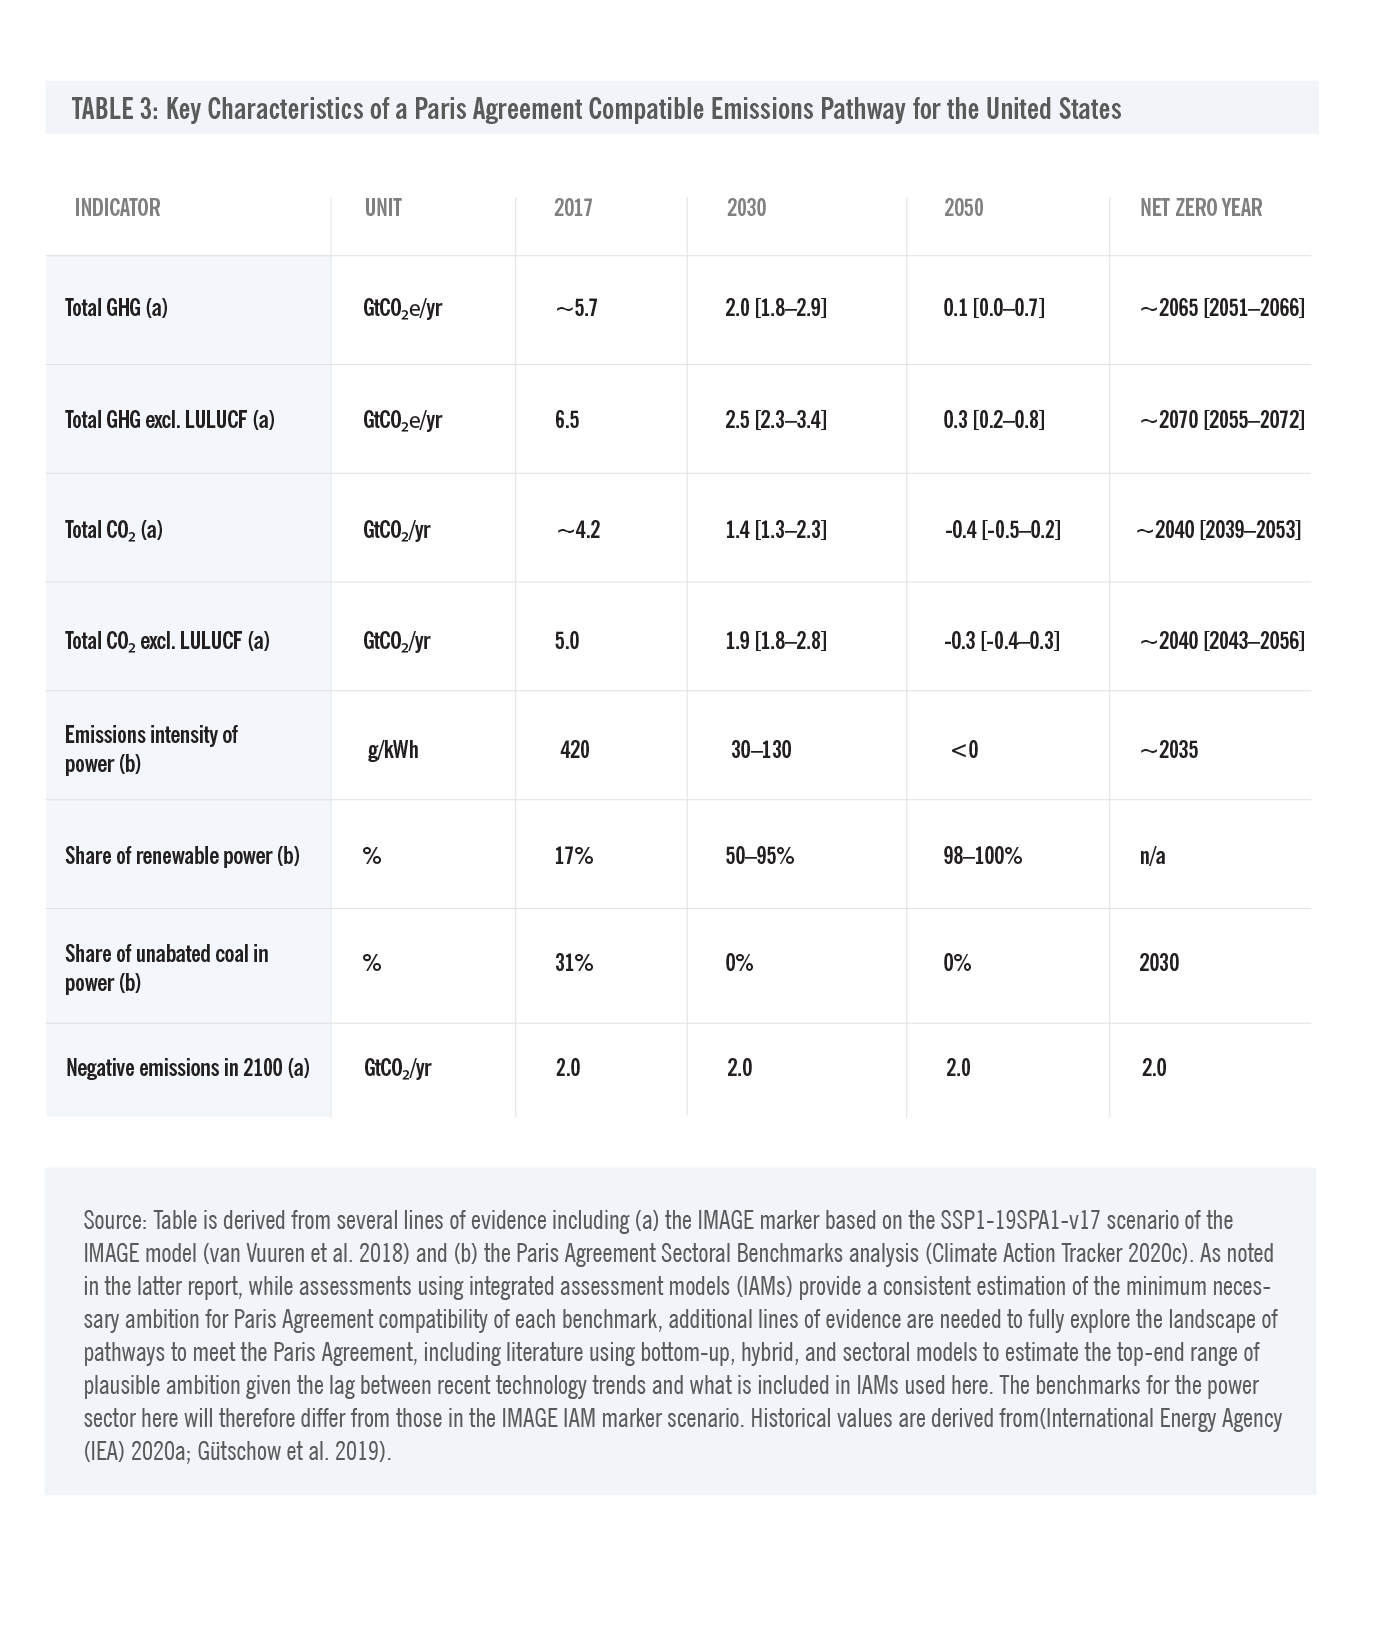
The marker pathway assumes drastic reductions before 2030, in line with scenarios at the lower end of the 1.5°C range. Full GHG emissions neutrality happens around 2065 with carbon neutrality by 2040.
This is catalyzed through full decarbonization of the power sector around 2035, after which emissions turn negative. Unabated25 coal is phased out by 2030 and renewables take a 98%–100% share by 2050.
Opportunities for action to close the gap
The United States has several options to increase its rate of decarbonization to bring emissions in line with these Paris Agreement benchmarks. The single most important step is phasing out coal from power generation. Coal use is already in steep decline in the United States as it can no longer compete with clean technologies, but additional action is required to ensure coal exits the power sector entirely by 2030 notwithstanding the domestic political challenges and the need to manage a just transition for affected communities. Such an accelerated shutdown would bring significant co-benefits in terms of decreased air pollution and fewer associated human health impacts.
The role of natural gas in power generation is another area for possible additional action. In Paris Agreement compatible pathways, gas use for electricity production without carbon CCS26 peaks relatively soon and declines quickly to a tiny share of global electricity supply by 2050. Any natural gas power generation (with or without CCS) would require balancing of the (residual) CO₂ and other emissions through negative emissions technologies. The volumes for this balancing could be significant in the case of unabated natural gas use.
Transforming all energy-using sectors to clean, zero-carbon sources will require significant shifts in investments and jobs away from polluting to clean technologies. The COVID-19 recovery spending packages following the pandemic are a golden opportunity to shift public spending to green investments: the total envisaged spending in these packages dwarfs the shifts in investments required to achieve the Paris Agreement goals (Andrijevic et al. 2020).
Biden Energy & Climate Package
Overview of the Biden Climate Plan and the Biden Clean Energy Plan
President-elect Biden’s campaign released a proposed policy platform consisting of an overarching Climate Plan and a Clean Energy Plan as well as a wider Environmental Plan. This overall Biden Energy and Climate Package contains several concrete policy ideas, including quantitative targets, aimed at decarbonizing the economy based on a zero-carbon energy system (see Figure 7).
In the following, we assess the emissions savings that can be expected from these targets and whether they add up to the decarbonization required to address the climate crisis.

The Biden Climate Plan
The Biden Plan for a Clean Energy Revolution and Environmental Justice, here the “Biden Climate Plan,” contains five major planks, the first of which contains a concrete, quantitative emissions target (“Biden Climate Plan” 2020) (Table 4).
The overarching goal of achieving net-zero emissions by 2050 is in line with the Paris Agreement compatible pathway for the United States, on the assumption that it covers all GHG emissions, rather than only CO₂.
The other quantitative goal of doubling offshore wind is discussed below as part of the Clean Energy Plan assessment.
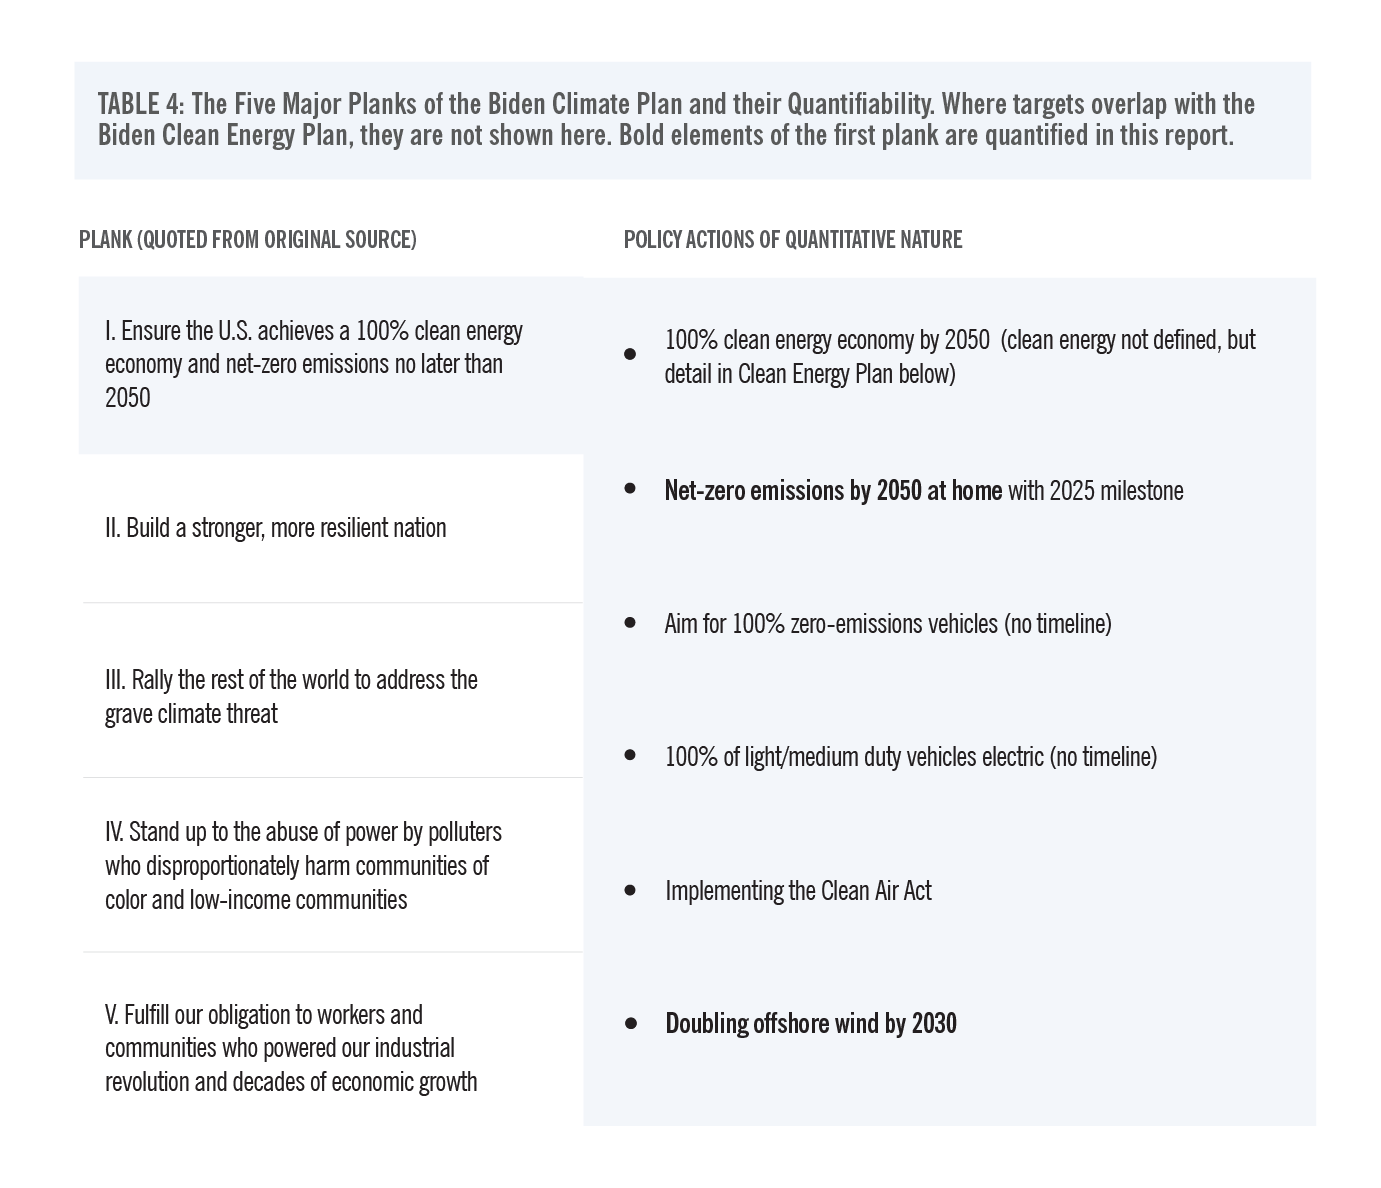
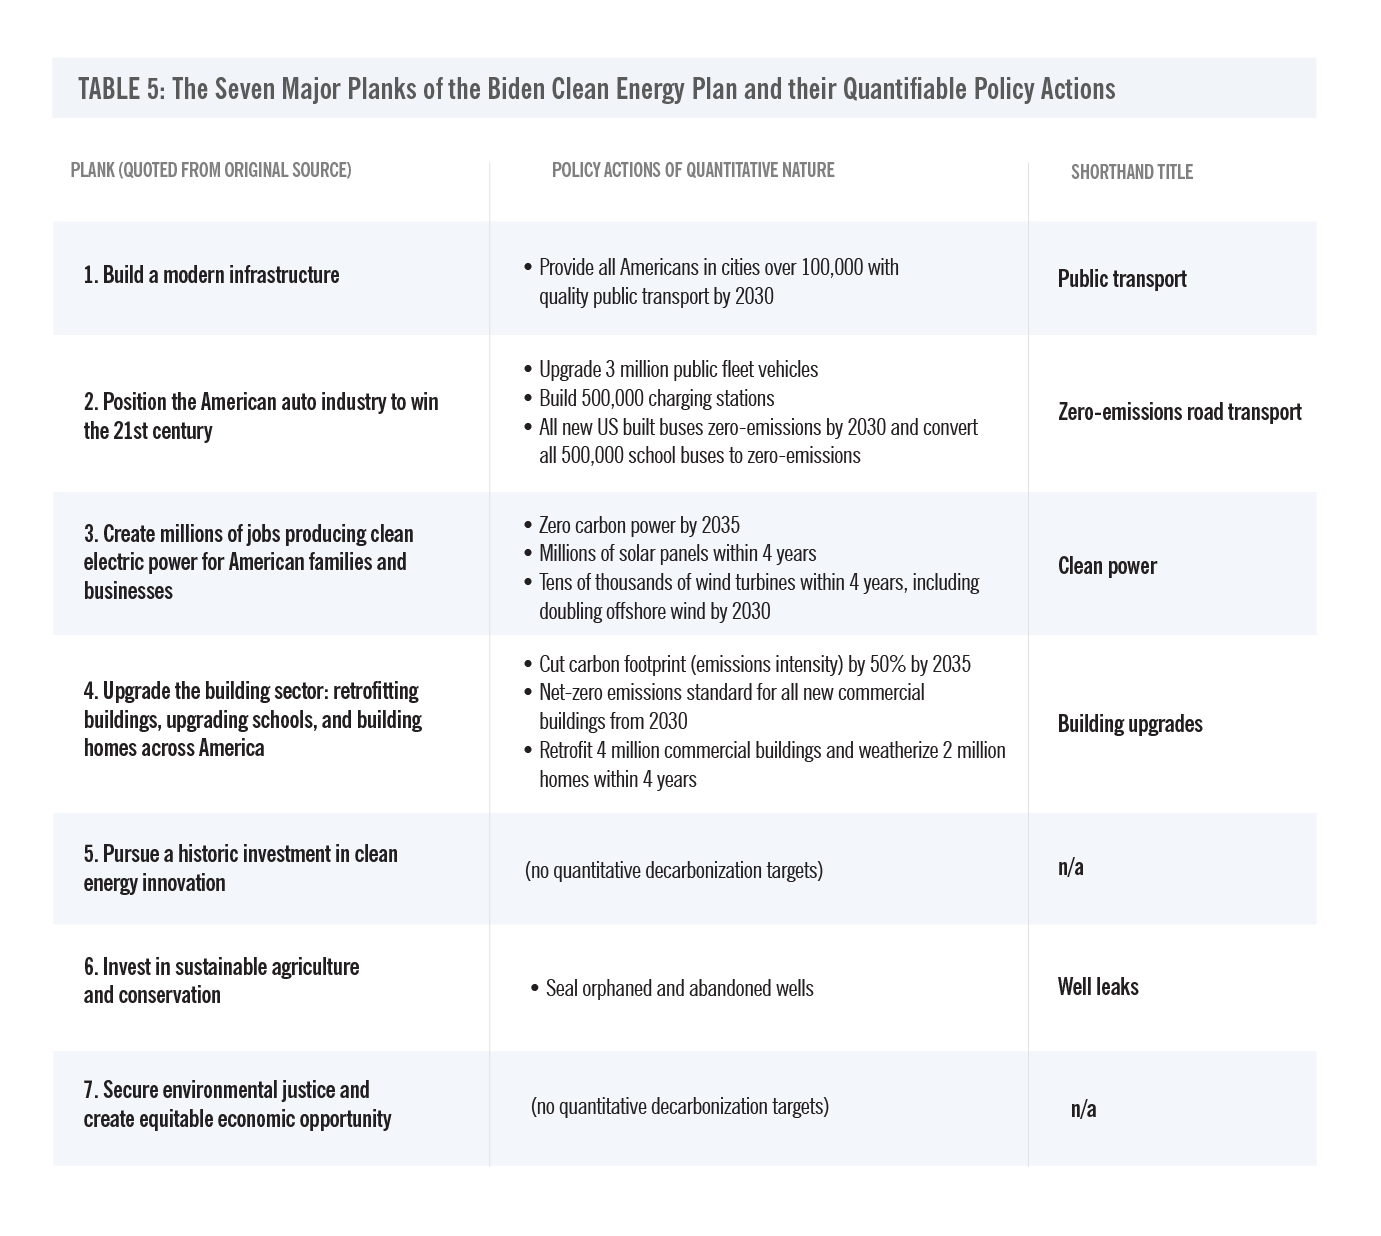
The Biden Clean Energy Plan
The Biden Plan to Build a Modern, Sustainable Infrastructure and an Equitable Clean Energy Future, here the “Biden Clean Energy Plan,” contains seven major planks, five of which have concrete, quantifiable targets (“Biden Clean Energy Plan” 2020) (Table 5). All of these targets further the overall goals in the Biden Climate Plan of a clean energy economy and net-zero by 2050 targets. The other two planks will also support achievement of these targets but could not be quantified for this assessment.
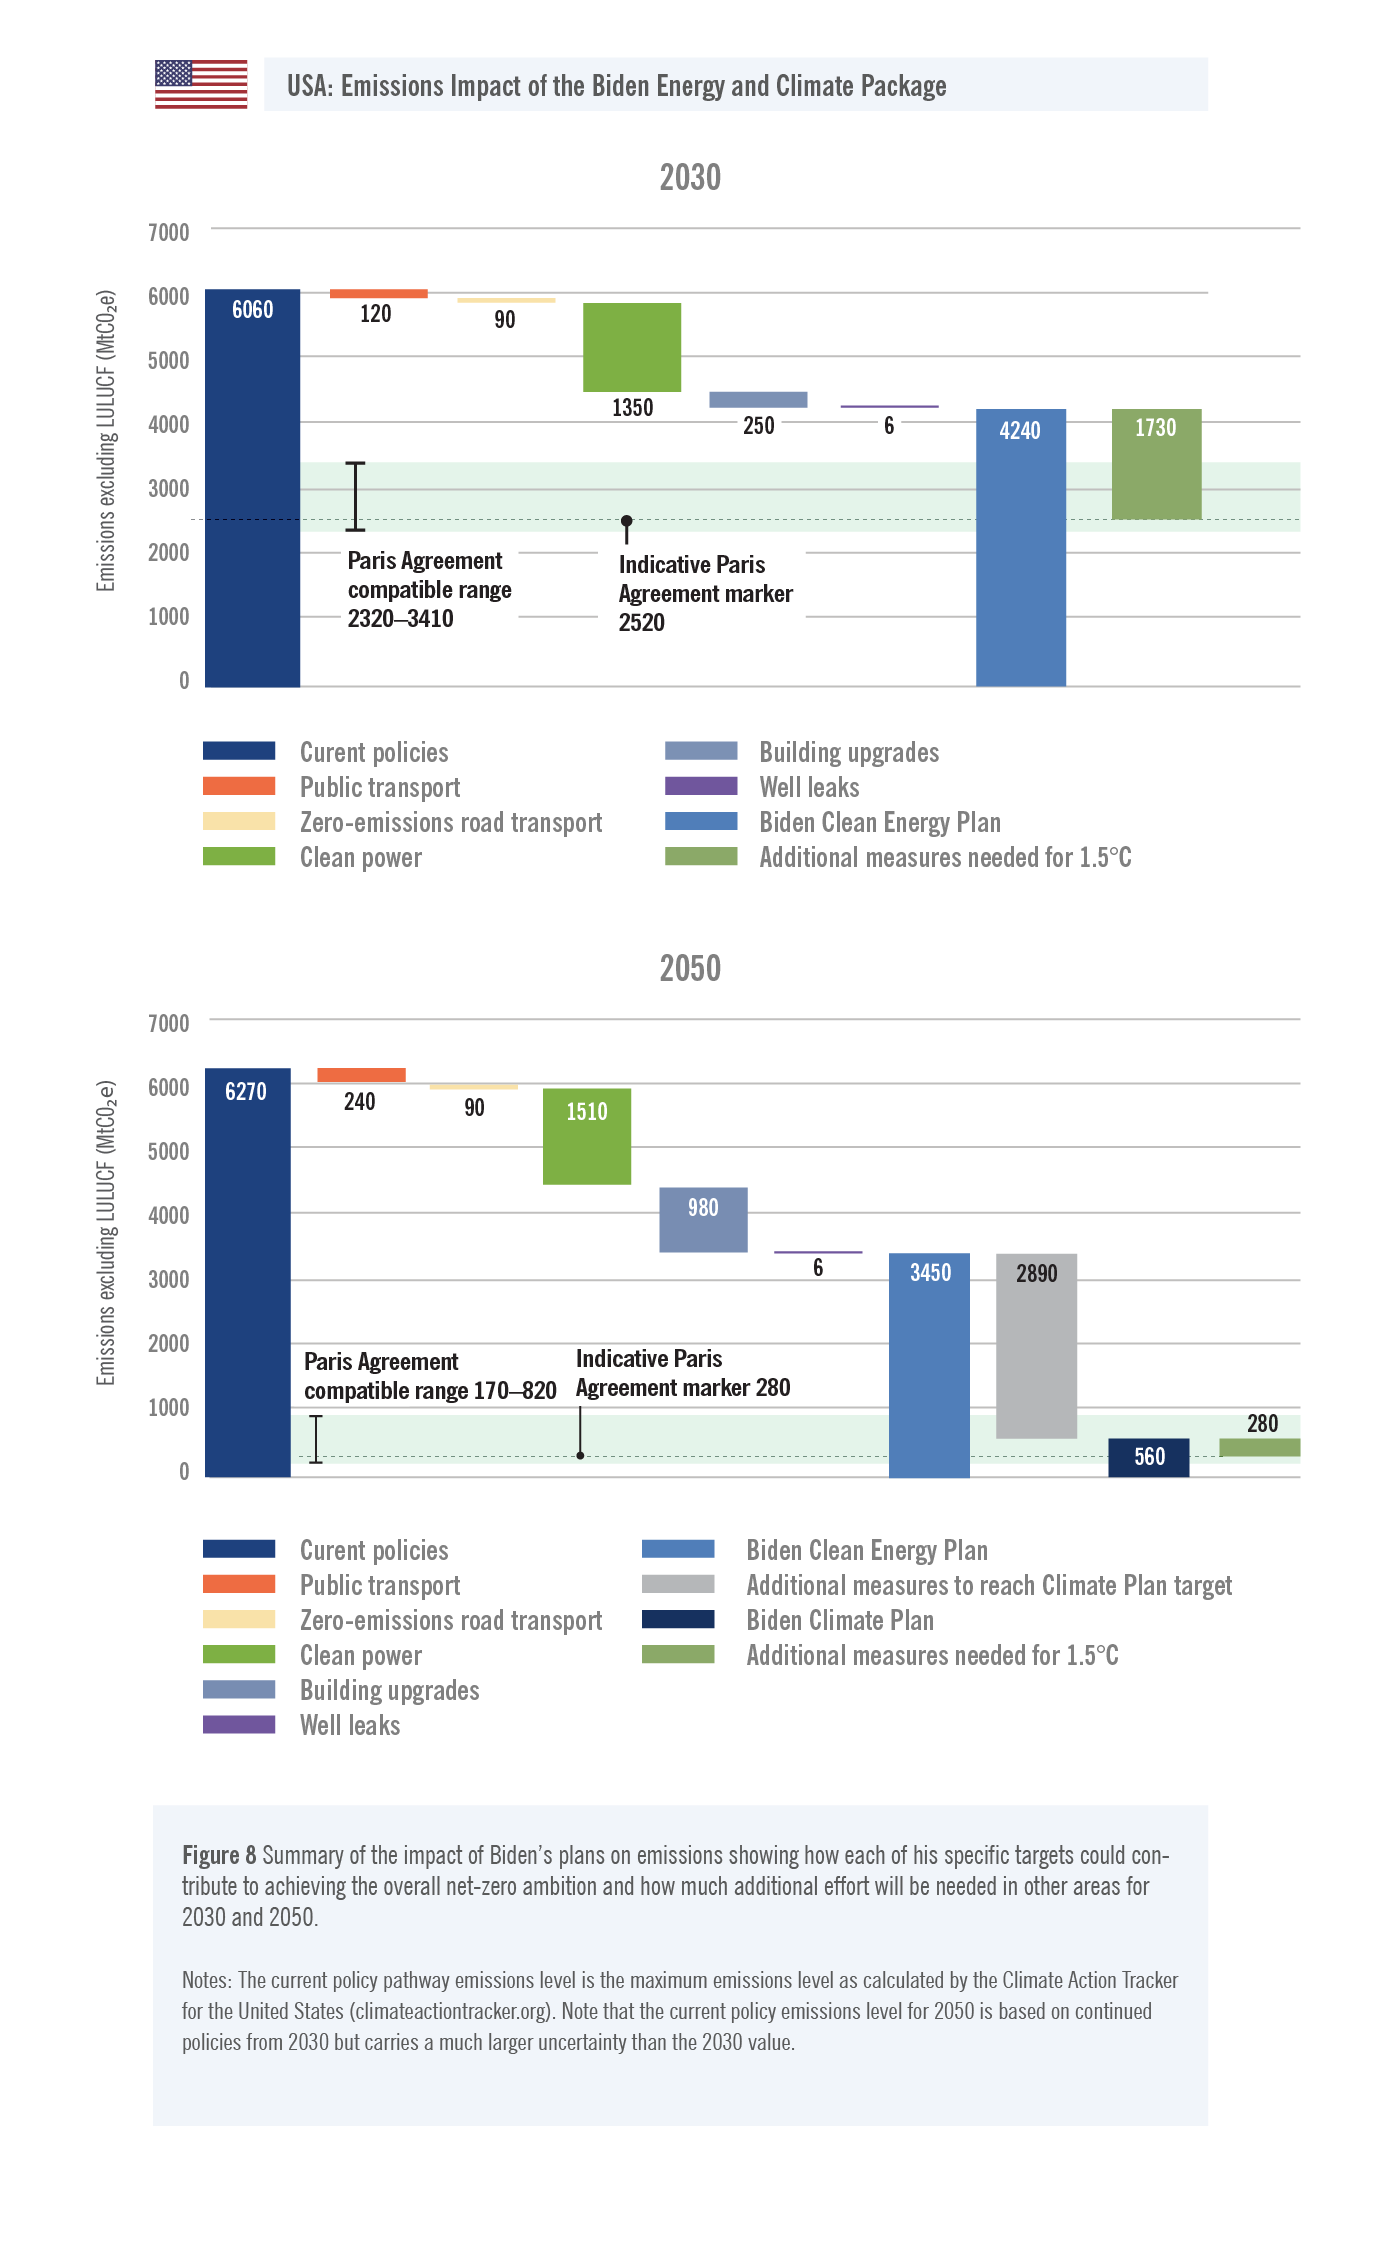
Summary of expected impact
The quantifiable aspects of the Biden Clean Energy Plan add up to ~1,810 MtCO₂e [1,360–2,100] emissions reduction in 2030 and 2,820 MtCO₂e [2,380–3,260] in 2050 (Figure 8). Adopting this policy package for 2030 would bring the United States closer to the Paris Agreement compatible pathway and would imply an emissions reduction of ~40%–47% below 2005 levels excluding LULUCF and 38%–54% below 2005 levels including LULUCF. Enshrined in an updated NDC, this would represent a significant increase in ambition from the current target of 26%–28%.
The single largest contribution to this emissions reduction would come from the decarbonization of the power sector by 2035, contributing around one-half to two-thirds of the total.
If the net-zero emissions target of Biden’s Climate Plan would also be pursued, it would imply additional reductions in 2050 of around 2,900 MtCO₂e [2,600–3,200] depending on whether it is a carbon or a climate neutrality goal. We find that the reductions in the Clean Energy Plan would suffice to achieve the implied 2030 emissions level under a 2050 net-zero target.
Options for implementation, including Executive Authority
There is a range of possible policy instruments to achieve the goals set out in the Biden package. These include new legislation and amending regulations under existing legislation, including standard-setting, provision of additional funding under a stimulus bill, use of funding under existing or new programs, support for state-level implementation, and executive action from the departmental or the presidential level. The choice of the appropriate instrument will depend not only on the policy to be implemented to achieve a given overarching goal but also on whether implementation should be driven at the federal, state, or local level and whether a political majority can be found to support a given route to implementation.
A full assessment of which elements of the Biden package can be achieved through executive action alone is outside the scope of this paper; however, based on this analysis from the Sabin Centre (Aidun et al. 2020) and executive action under the Obama administration (White House 2015), we estimate that of the full abatement potential of ~1,810 MtCO₂e in 2030, between 340 MtCO₂e and 1,570 MtCO₂e may be achievable in principle. However, a key consideration will be the time delay in completing any new rulemaking as well as legislative and judicial constraints on executive power (Woodroofe and Guy 2020)—the expected makeup of the Senate is of particular importance in this regard. Nevertheless, a number of policies may also be possible through subsequent COVID-19 recovery packages, given their synergies with economic stimulus and job creation. Finally, even in the case of delays and challenges to federal action, the efforts of state and local actors, such as the We Are Still In campaign, are expected to continue. A recent study estimated that enhanced action by subnational actors alone in the United States could reduce emissions by 37% below 2005 levels by 2030 (Hultman et al. 2020).
We describe the quantification of each of the planks in the following sections.
“Build a Modern Infrastructure”: Providing public transport choice in cities
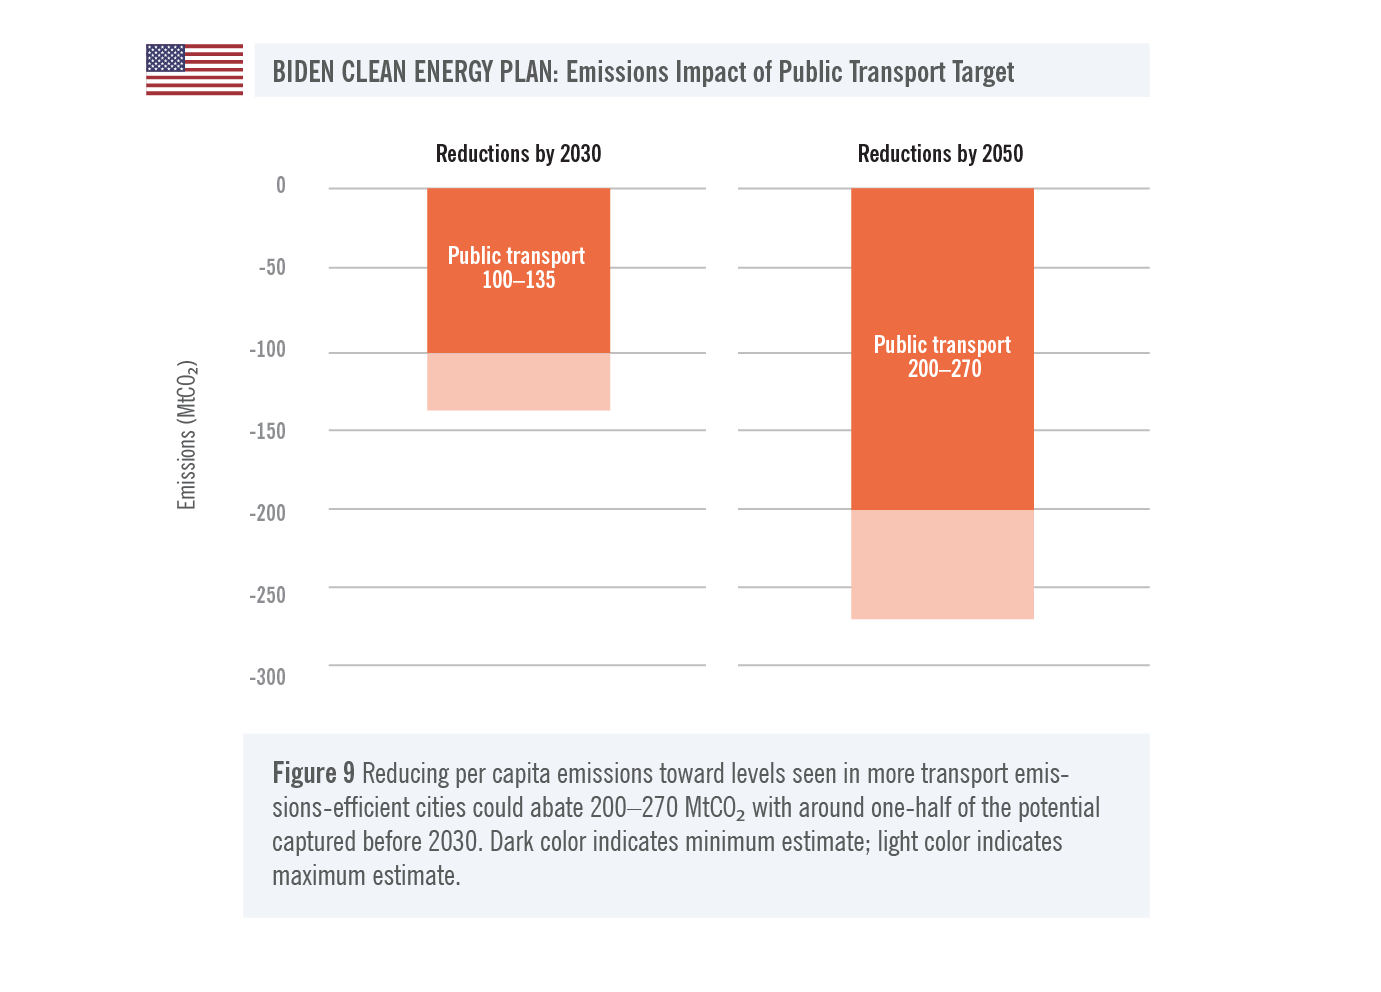
As part of an overall policy package aimed at improving a range of infrastructures in the United States, the Biden Energy and Climate Package contains a specific call to invest in public transport for cities with populations of more than 100,000 inhabitants to ensure citizens have access to high-quality public and active transport infrastructure.
This is expected to result in a shift from emissions-intensive individual motorized transport to less emissions-intensive modes.
Based on an assumption that moving from poor- to high-quality public transport systems would yield a per person emissions-intensity reduction from one-third to one-half, we estimate emissions savings of 200–270 MtCO₂ per year.
Given the length of implementation of transformative public transport solutions, such as over- and underground rail systems and revamped urban-planning concepts, we assume that up to one-half of this potential could be realized within 10 years.
These results are summarized in Figure 9.
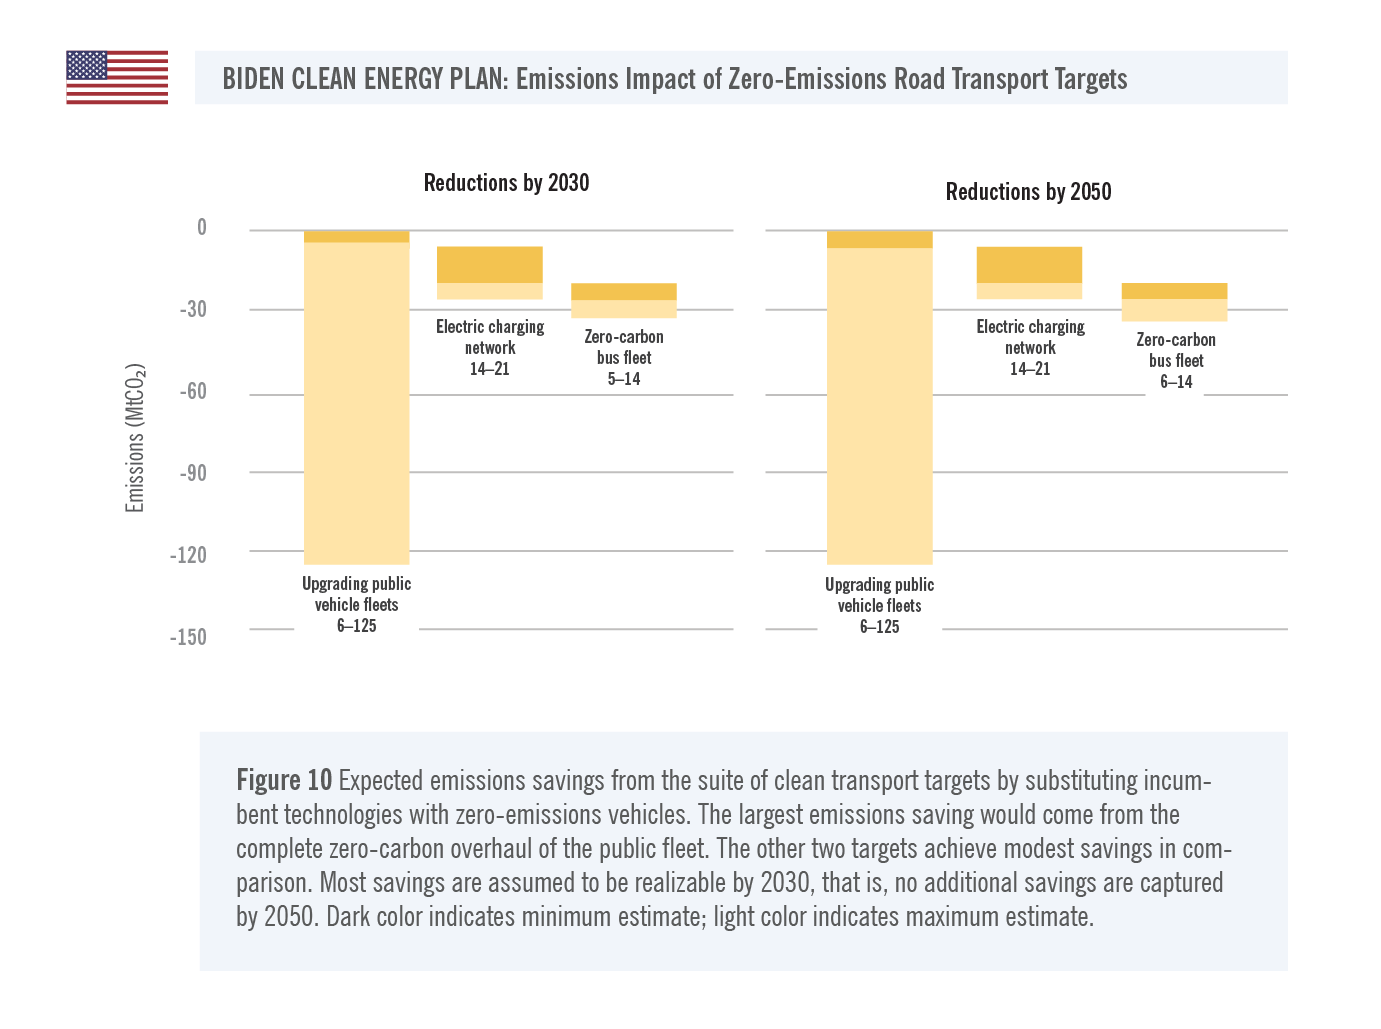
“Position the U.S. Auto Industry to Win the Twenty-First Century”: Electrification of road transport
The Biden plan makes the following references to concrete, quantifiable targets in the transport sector, beyond this public transit promise:
Upgrade 3 million public fleet vehicles to “clean vehicles”
Build 500,000 electric vehicle charging stations
All new U.S.-built buses zero emissions by 2030 and convert all 500,000 school buses to zero emissions
Upgrade 3 million public fleet vehicles to clean vehicles
The Biden plan contains a federal commitment to purchasing 3 million clean vehicles for public fleets. The target is not drive-train specific, but we have assumed these to mean completely zero-carbon vehicles (as opposed to hybrids), and that each of these would replace a small van powered by gasoline or diesel. Assuming that these vehicles in public fleets drive between 1,900 and 8,500 km per year results in an estimate of their emissions of 20–230 MtCO₂ per year. It should be possible to purchase all of these vehicles within Biden’s first term, that is, well before 2030, providing the full abatement benefit for 2030 and 2050. Taking into account existing local programs to replace public fleet vehicles with more efficient and/or electric versions during the normal replacement cycles results in a potential of 6–125 MtCO₂, which could be abated in addition to these existing programs.
Build 500,000 electric vehicle charging stations
The adoption of electric vehicles is supported in a number of countries by a range of policies, including the provision of public charging infrastructure. Although the vast majority of chargers (>80%) are private, a public network can help support adoption by extending range where needed. Biden’s plan to build 500,000 electric vehicle charging stations appears to be easily achievable, given that there are already almost 100,000 chargers in the United States with build-out continuing apace (International Energy Agency (IEA) 2020b).
In line with global figures, we estimate that the deployment of these charging stations could encourage the purchase of around 3–4.5 million electric vehicles, abating around 14–21 MtCO₂.This is assuming that these chargers and any increase in electric vehicle adoption would be additional to current local policies.
All new U.S.–built buses zero emissions by 2030 and convert all 500,000 school buses to zero emissions
Converting all ~500,000 school buses in the United States to zero-emissions technology would abate an estimated 11 MtCO₂ per year. If we assume that this transition is completed before 2030, this reduction would be fully captured by 2030.
There are around 130,000 other buses in the United States, emitting around 8 MtCO₂. Assuming a lifetime of transit buses and motor coaches of 4–12 years, a zero-emissions standard enacted in 2021 could lead to a 75%–100% emissions reduction for the fleet by 2030, that is, 6–8 MtCO₂.
Of this total of 17–19 MtCO₂ emissions savings from replacing these buses, we estimated that 5–14 MtCO₂ would be additional to savings which would occur in the absence of additional policy support in 2030 (6–14 MtCO₂ by 2050).
Depending on the ownership of these bus fleets, there may be some overlap with the public fleet target noted above, but we have assumed this to be negligible.
Summary
We have estimated 17–19 MtCO₂ of emissions savings from moving all except imported buses to zero emissions, covering 90% of that sector. Around 5–14 MtCO₂ of this potential is estimated to be additional to existing efforts in 2030 (6–14 MtCO₂ by 2050). A larger emissions reduction potential comes from the conversion of all public fleet vehicles to zero-carbon vehicles; we estimate this potential at 8–120 MtCO₂ in addition to reductions from existing efforts.
For light-duty vehicle transport, additional charging stations could spur adoption of additional 3–4.5 million electric vehicles, abating 14–20 MtCO₂. However, this is still only a small share of the total of road emissions of 1,500 MtCO₂.27 There are more than a quarter-billion passenger cars in the United States, with around 6 million sold every year. Meaningful emissions reductions in this sector require a policy covering all of these passenger cars, such as the improved vehicle standards mentioned in the Biden plan. In addition, emissions from freight transport need to be addressed with analogous measures.
These results are summarized in Figure 10.
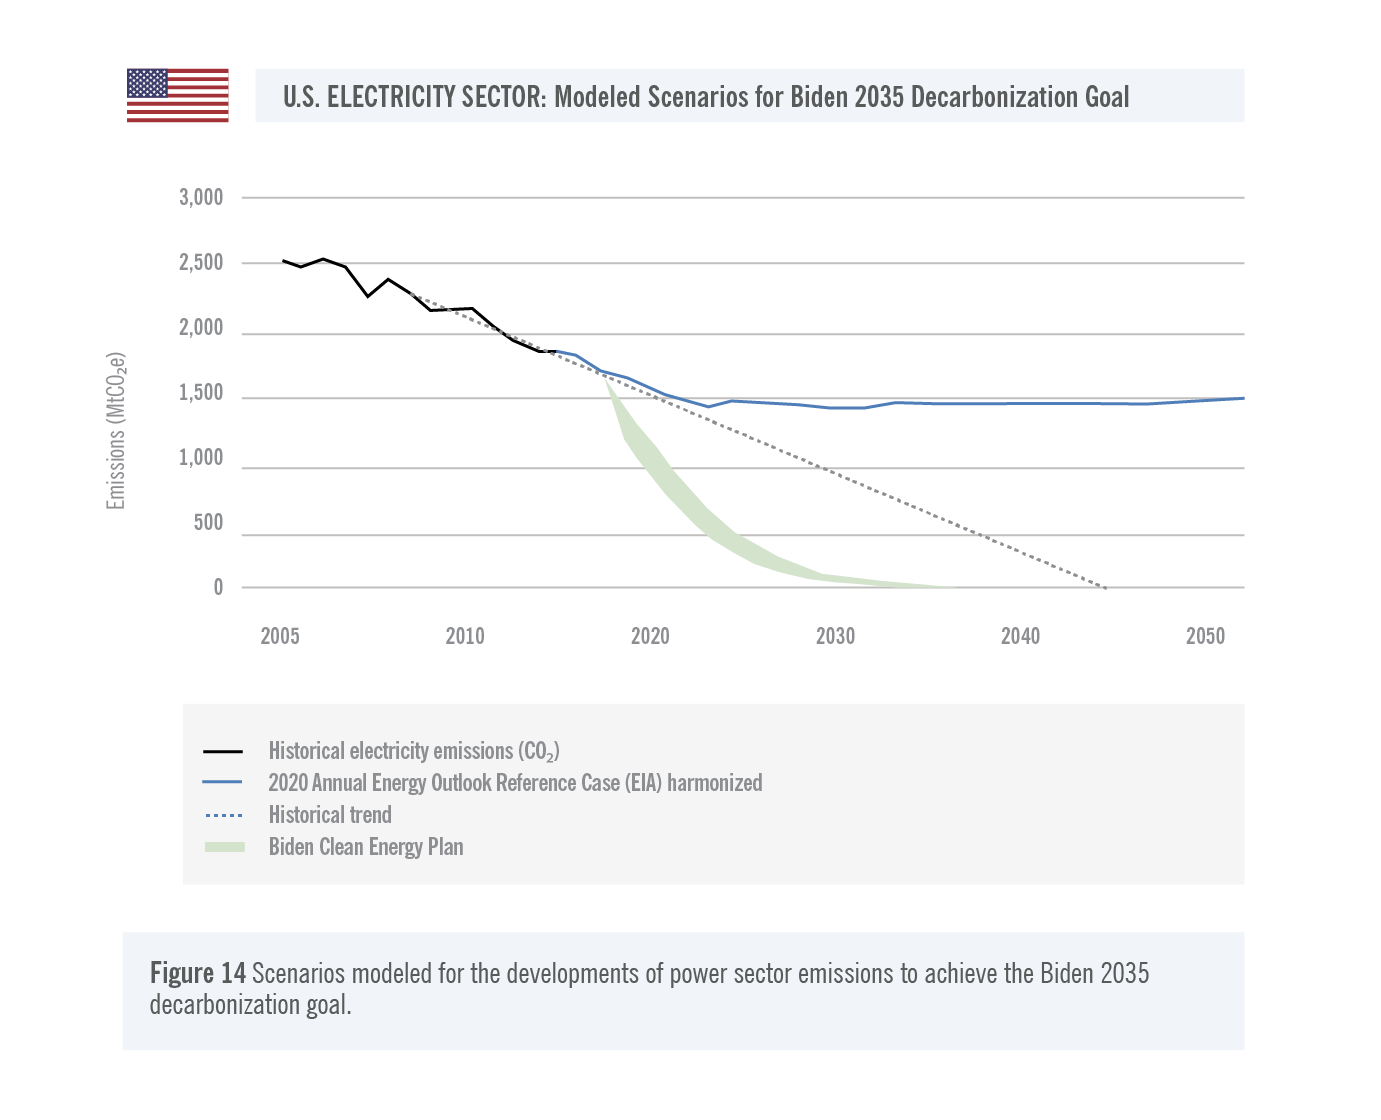
“Millions of jobs producing clean electric power”: Carbon-free electricity by 2035
The Biden package spells out four concrete targets for the power sector:
Zero-carbon power by 2035
Millions of solar panels within four years
Tens of thousands of wind turbines, including thousands offshore, within four years, including
Doubling offshore wind by 2030
Zero-carbon power by 2035
The central plank of the Clean Energy Plan is the goal of a zero-carbon power system by 2035. This will not only eliminate most of the direct emissions from electricity production by 2030 but is also a prerequisite for decarbonization in other sectors: as energy demand electrifies, for example, by transitioning to electric vehicles for transport and heat pumps for building heat, emissions savings are maximized if the electricity to power these vehicles is carbon free.
We estimate savings of 1,315–1,380 MtCO₂ by 2030 and ~1,510 MtCO₂ by 2050 from this target, compared with the Reference Case in the Annual Energy Outlook (AEO) of the U.S. Energy Information Administration (EIA).
Millions of solar panels in four years
The plan includes a goal to “spur the installation of millions of solar panels – including utility-scale, rooftop, and community solar systems … in Biden’s first term.”
This will be part of the overall zero-carbon power plan, rather than achieving additional reductions.
We estimate savings from a rollout of between 1 and 10 million additional solar panels in the period 2021–2024 to abate 0.1–1.9 MtCO₂ in 2030 and 0.1–1.6 MtCO₂ in 2050. We have not assumed additional incremental capacity installations after 2024, although it is likely that growth would continue.
In the context of the overall target, and given the potential for solar photovoltaics (PV) compared with other sources, it is clear that this target would need to be increased significantly to deliver the zero-carbon power by 2035 ambition, for example, by continuing the growth of solar deployment beyond 2024.
Tens of thousands of wind turbines and doubling offshore wind
The plan also includes a goal to install “tens of thousands of wind turbines—including thousands of turbines off our coasts—in Biden’s first term.” As with the solar targets, this will help achieve the overall zero-carbon power goal rather than providing additional reductions.
We estimate the following savings from a rollout of between 1,000 and 10,000 additional offshore wind turbines and between 10,000 and 50,000 onshore wind turbines in the period 2021–2024:
Savings in 2030: 15–250 MtCO₂ from onshore and 8–140 MtCO₂ from offshore wind
Savings in 2050: 35–215 MtCO₂ from onshore, and 12–120 MtCO₂ from offshore wind
Given the untapped potential for wind power and the additional emissions reductions required to achieve the overall zero-carbon power target, it is expected that this target would need to be increased to achieve a zero-carbon power system by 2035.
We have not evaluated the goal stated in the Climate Plan to “double offshore wind by 2030,” as this would be a much smaller target than those outlined here. The current offshore wind power installation stands at 42 MW (=0.042 GW), while our previous estimate for 2030 assumes 8–140 GW (Stromsta 2020b).
Summary
We find that the overall emissions savings potential from the quantifiable targets for the power sector in the Biden plan amount to 1,350 MtCO₂ in 2030 and 1,510 MtCO₂ in 2050, as defined in the overall goal of zero-carbon power by 2035. The specific targets for solar panels and wind turbines individually have a smaller impact than this overarching goal but are necessary (and not yet sufficient) to achieve that objective, as shown in Figure 11.

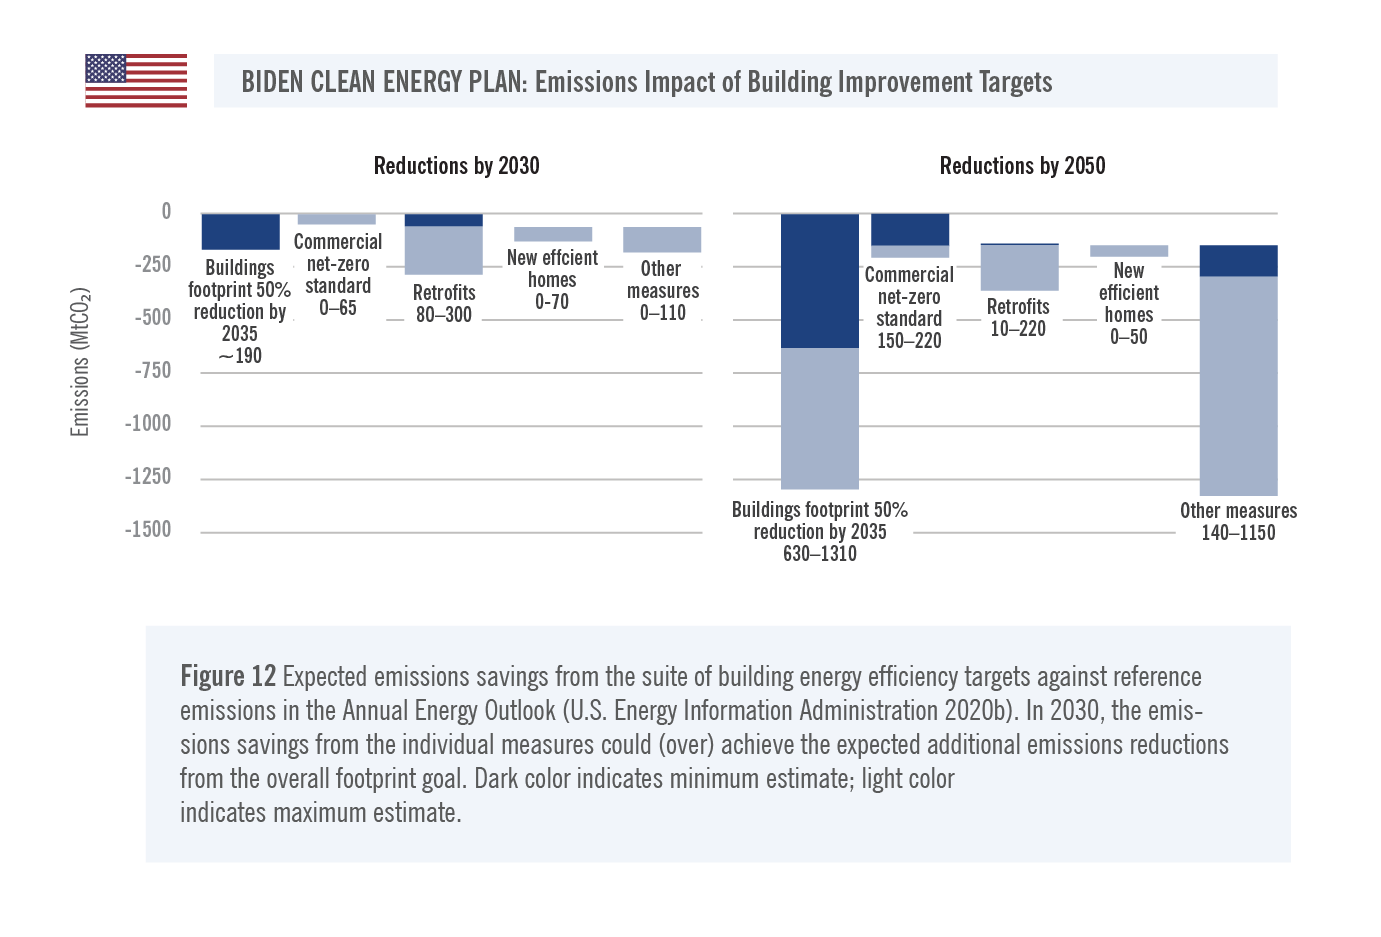
“Dramatic investments in energy efficiency in buildings”
The Clean Energy Plan contains four policy goals aimed at improving U.S. building stock:
Cut carbon footprint (i.e., emissions intensity) by 50% by 2035
Net-zero emissions standard for all new commercial buildings from 2030
Four million commercial retrofits and weatherization of 2 million homes within four years
Build 1.5 million energy-efficient public homes
The plan also calls for repairing the building code and establishing building performance standards for existing buildings, but we did not quantify this policy goal here.
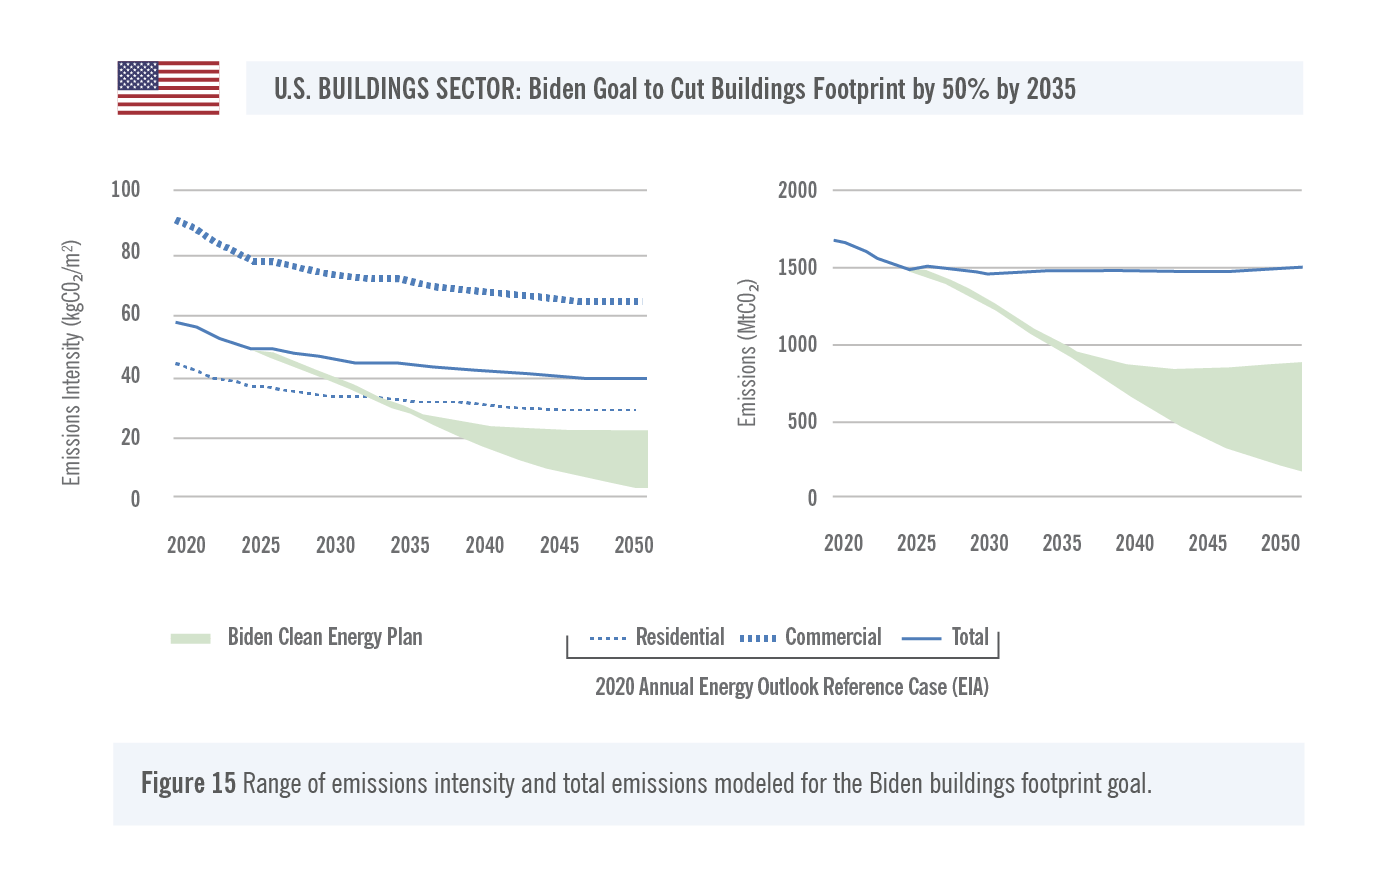
Cut carbon footprint (i.e., emissions intensity) by 50% by 2035
The United States currently emits between 50 and 100 kg CO₂ per square meter of building floor space, with the lower value typical of the residential building sector and the upper value of the commercial sector. Energy efficiency and decarbonization efforts already underway are expected to more than offset the projected ~17% increase in floor space by 2035, resulting in a decrease in total emissions of 16% over the same period. This implies a reduction in emissions intensity, that is, emissions per square meter, of ~29%.
In his Clean Energy Plan, Biden said he would speed up these efforts, to reach a 50% reduction in emissions intensity by 2035, almost double the expected rate. We estimate that this would result in emissions savings of ~190 MtCO₂ in 2030 compared with the Reference Case of the AEO.
Depending on whether carbon footprints level off just below that intensity at ~24 kg/m2 or continue to improve at a similar rate to reach 5 kg/m2, emissions savings in 2050 could be between 630 and 1,310 MtCO₂, compared with the AEO Reference Case.
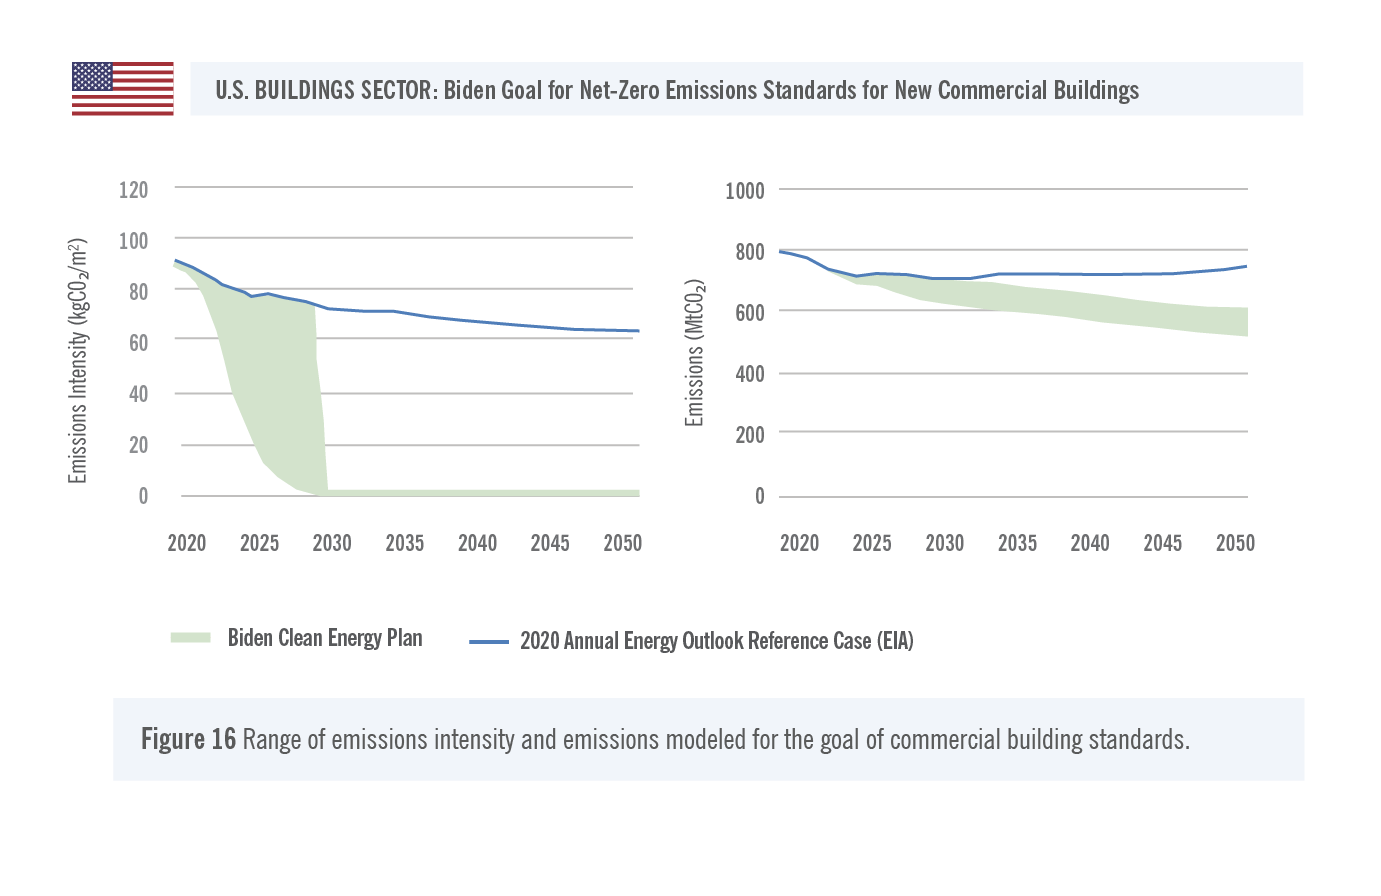
Net-zero emissions standards for all new commercial buildings by 2030
Commercial buildings account for less than one-third of building (floor) space but are responsible for almost one-half of the emissions from the sector. The Biden plan proposes building standards that will ensure that all commercial buildings built from 2030 onward will have net-zero emissions. This is typically achieved through a very high energy efficiency standard and a mostly electric energy supply (e.g., using heat pumps for heating and hot water) and ensuring that the electricity used to power the building is zero carbon, often by including PV on rooftop and façades. The European Union has a similar nearly zero energy standard that will be mandatory for all (not only commercial) buildings beginning in 2021.
We estimate the emissions savings from the Biden target for a new commercial building net-zero energy standard at 0–65 MtCO₂ in 2030 and 150–220 MtCO₂ in 2050, depending on whether property developers gradually adopt the standard before 2030 in preparation for a mandatory standard in 2030. This would be one policy action to achieve the overall emission footprint goal noted above.
Four million commercial retrofits and weatherization of 2 million homes within four years
Given the long lifetime of buildings, meaningful decarbonization in the building sector needs to address emissions from the existing stock as well. The Biden plan includes ambitious retrofit targets aiming to reach 4 million commercial buildings and 2 million residential buildings within four years. This would imply a significant increase in retrofit rates for residential buildings close to and, in the case of commercial buildings, even above the 5% a year benchmark for required retrofit rates under Paris Agreement compatible pathways (Kuramochi et al. 2017). The implied rate for commercial buildings is so high that it would reach almost two-thirds of the commercial stock. By contrast, the 2 million residential homes would cover less than one-fifth of homes.
We find that emissions savings from these pre-2025 retrofits would persist over time, yielding 70–235 MtCO₂ for commercial and 15–60 MtCO₂ for residential buildings in 2030 with the range stemming from the uncertainty over the depth of the retrofit: we have assumed between 30% and 60% reductions in emissions after the retrofit, although higher rates are possible. The emissions savings are expressed with respect to a baseline where more gradual improvements over time are assumed.28 Against this baseline, the 2050 emissions savings are much smaller at 10–180 MtCO₂ for the commercial retrofits and 0–40 MtCO₂ for residential retrofits.
Build 1.5 million energy-efficient public homes
The final target we can quantify is the plan to build 1.5 million energy-efficient homes. This policy goal gives us an indication of what the Biden plan defines as “energy-efficient” as it specifies that these could save up to US$ 500 yearly on energy bills. The average energy bill for U.S. households is around US$ 1,800, which would imply that these new homes would be ~30% more efficient than the average home today. A lower comparison value may be more appropriate, as these homes are likely going to be smaller than average, potentially leading to up to 40%–50% savings.
However, given the net-zero ambition for new commercial buildings and the fact that it is becoming common practice elsewhere in the world to build new buildings that require virtually no energy supply, we use a range of 30%–80% below the current average for the energy use, and thus the emissions, of these new homes.
Assuming further that these new homes will allow families to move out of less-efficient housing, we estimate the emissions saving potential of this policy goal at 0–70 MtCO₂ in 2030 and 0–50 MtCO₂ in 2050 in comparison with current emissions trajectories. The lower bound of zero reflects uncertainty in this assumption: if these homes are simply additional to existing building stock, they would not lead to emissions savings.29
Summary
Figure 12 shows the results for our emissions savings estimates for the suite of building energy efficiency targets in the Biden plan. The overarching goal of halving the footprint of the national building stock by 2035 will be achieved by the individual retrofit actions and efficient new builds in combination with additional efforts. In 2030, these bottom-up efforts could be sufficient to achieve the overarching goal and even exceed it. For 2050, additional efforts may be needed if the carbon footprint should decrease further beyond 2035.
These results are summarized in Figure 12.
“Conservation”: Fix leaking wells
Within its Conservation section, the Biden plan picks up an interesting policy idea: to use the extensive technical expertise of the oil and gas industry workforce to seal orphaned and abandoned oil and gas wells that have not been properly closed and are leaking greenhouse gases into the air. Together with a similar effort to clean up disused mines, Biden hopes to create up to 250,000 jobs.
This idea of sealing oil and gas wells was discussed and evaluated in depth by a Columbia University and Resources for the Future scientific study, published in July 2020 (Raimi, Nerukar, and Bordoff 2020). The study estimated that there are around 2 million orphaned and abandoned oil and gas wells in the United States, leaking 2–11 MtCO₂e of methane per year. Depending on whether Biden intends all or only half of the 250,000 jobs to go to the well-sealing program, this means the wells could be sealed within two to four years, in any case long before 2030. We, therefore, assume that the full 2–11 MtCO₂e can be saved in both years.
These results are summarized in Figure 13.

Conclusion
This report has demonstrated that if China’s net-zero target were to cover all GHG emissions, it would bring its long-term strategy in line with Paris Agreement compatible emissions levels for mid-century, provided it also aims for an early peaking by 2025 and steep reduction of emissions by 2030. To achieve net zero emissions before 2060, China would need to stop building unabated coal power plants, reduce the use of coal for power generation rapidly to a 5%–10% share in 2030, and phase out the use of coal-fired power generation by 2040. This implies a drastic reduction of utilization rates and/or retirement of recently built plants before the end of their technical or economic lifetime.
Additionally, this report has also demonstrated that China’s peaking of emissions around 2025 would help avoid unmanageably steep decarbonization rates in the period after 2030 and limit the need for large negative emissions volumes after 2060. This could represent one element of a strengthened Chinese NDC before COP26 as part of the Paris Agreement’s mechanism to ratchet up ambition every five years.
At the same time, President-elect Biden’s Energy and Climate Package touted during his campaign could provide a strong basis for renewed engagement by the United States in the global fight against climate change. In addition to reversing the policy rollbacks of the Trump administration, the Biden package would scale up climate action drastically, potentially reaching 38%–54% (including LULUCF) emissions reductions below 2005 levels by 2030. In the short term, this would bridge more than half of the gap to achieving emissions levels in line with a Paris Agreement compatible pathway.
In the long term, President-elect Biden’s pledge to reach net-zero emissions by 2050 would then close that gap entirely if it includes all greenhouse gas emissions, provided it is reached without delaying the steep emissions reductions necessary by 2030, and additional actions are undertaken—especially on freight transport and industry. However, it is important to emphasize that the Biden package will require the support of Congress to be fully implemented, and this report estimates that potentially only half of President-elect Biden’s policies can be implemented through Executive Authority (although there is a large degree of uncertainty).
Nevertheless, taken together, China’s recent announcements and the Biden Energy and Climate Package, if fully implemented, would reduce estimates for average temperature increases in 2100 by 0.2°C–0.4°C to 2.3°C–2.4°C. While global efforts are still not enough to stay within the long-term temperature goal of 1.5°C established by the Paris Agreement, each of these individual contributions would represent two essential factors in terms of global efforts to do so since the agreement was adopted five years ago.
This report, therefore, provides a degree of insight to both the United States and China, as well as the world’s other major emitters, as they formulate their formal contributions to enhance ambition for both 2030 and mid-century ahead, including in the lead-up to COP26.
Methodology
Quantification of the expected emissions level for long-term targets
For the long-term targets recently announced by China (net-zero before 2060) and in the Biden Climate Plan (net-zero by 2050), we calculated expected emissions reductions under two possible interpretations:
GHG neutrality (climate neutrality), meaning the targets are interpreted as implying net-zero emissions by the target year for GHG (including LULUCF)
CO₂ neutrality (carbon neutrality), meaning that only carbon dioxide will be in balance by the target date (including LULUCF). We then assume non-CO₂ gases reaching net-zero 20 years later.
We differentiated these two interpretations further into two scenarios, with the following:
A “minimum emissions” scenario assuming that the emissions trajectory changes in 2025 toward a direct reduction pathway to the target, starting from the minimum emissions level in 2025 estimated by the Climate Action Tracker in its Current Policy Pathway.
A “maximum emissions” scenario assuming that the emissions trajectory changes in 2030 toward a direct reduction pathway to the target, starting from the maximum emissions level in 2030 estimated by the Climate Action Tracker in its Current Policy Pathway.
(The Current Policy Pathways are taken from the U.S. and China country analyses of the Climate Action Tracker. Available at https://climateactiontracker.org/countries.)
The final numbers were expressed in terms of total GHG emissions excluding LULUCF by subtracting LULUCF projections from the IMAGE marker scenario (van Vuuren et al. 2018).
Quantification of the expected impacts of the Biden Clean Energy Plan
Providing public transport choice in cities
In 2019, about 95 million Americans were living in cities of more than 100,000 population (U.S. Census Bureau 2020). Annual ground transport emissions per person vary by an order of magnitude across these cities from around 1–2 tCO₂/capita to up to almost 10 tCO₂/capita and are influenced by several factors, including density and socioeconomic levels (Gately, Hutyra, and Wing 2015).
Introduction of high-quality public transport can be expected to bring emissions per capita down toward the lower levels within this range – for example, those seen in San Francisco and New York. Based on this, we have estimated that high-quality public transport could results in an average reduction in emissions per capita of one-third to one-half. This results in emissions savings of 200–270 MtCO₂ per year.
Upgrade 3 million public fleet vehicles to clean vehicles
The assumption is that these 3 million vehicles will replace typical small vans on average and that these vehicles drive on average 1,900 to 8,500 km per year. Estimating vehicle efficiencies of ~10–25 ltr/100km [10–25 mpg] for a typical age fleet, we calculate annual emissions per vehicle at ~6–80 tCO₂/vehicle. Converting 3 million of these vehicles to zero-carbon substitutes would result in emissions savings of 20–230 MtCO₂ per year.
We further assume that electric vehicles would replace 10%–20% of these vehicles by 2030 without additional action and that a further 40%–50% would be replaced by the most efficient vehicles on the market today as part of their natural replacement cycle, leading to an estimate of 6–125 MtCO₂ emissions savings potential in addition to existing efforts.
Build 500,000 electric vehicle charging stations
Based on the growth in electric charging infrastructure and electric vehicles over the past 10 years, we determined a correlation between number of electric vehicles and number of charging stations, with a range of 6–9 vehicles per charging station (International Energy Agency (IEA) 2020b).
Current average emissions per light-duty vehicle are estimated at 4.6 MtCO₂/vehicle/year by the Environmental Protection Agency (EPA) (Environmental Protection Agency 2018). This means that the expected 3–4.5 million electric vehicles that may be purchased to replace existing vehicles would abate around 14–21 MtCO₂.This is assuming that these chargers and any increase in electric vehicle adoption would be additional to current local policies.
All new U.S.-built buses zero emissions by 2030 and convert all 500,000 school buses to zero emissions
The number of non-school buses and their annual fuel consumption were taken from the American Public Transportation Fact Book 2020 (data for 2018) and combined with EPA standard emissions factors to calculate total annual emissions for non-school buses of ~8 MtCO₂. We also read out vehicle miles from the same source to calculate an average bus emissions intensity per distance of ~1.2 kgCO₂/km (~1.9 kgCO₂/mile) to use for the school bus calculations.
For school buses, we assumed the same emissions intensity as for non-school buses as above. Based on an assumption of these buses accumulating around 6 billion vehicle miles per year (New York School Bus Contractors Association 2020), we calculated annual emissions of ~11 MtCO₂e.
We then assumed that between 30% and 70% of this effort would be additional to existing local efforts, leading to a total additional emissions reduction estimate of 5–14 MtCO₂ in 2030 (6–14 MtCO₂ by 2050).
Achieve a carbon-pollution-free power sector by 2035
Without detail on the expected deployment rates of technology and policy to achieve the 2035 carbon-free target, we modeled a range of S-curve–shaped reduction of CO₂ emissions from historical values toward zero by 2035 (Figure 14). Historical CO₂ emissions of power were based on statistics of the EIA (U.S. Energy Information Administration 2015; 2018a). Savings were calculated versus current policy as defined by EIA’s AEO 2020 Reference Case (harmonized to a historical 2018 point) (U.S. Energy Information Administration 2020b). We find 1,315–1,380 MtCO₂ savings in 2030 (range from different S-curve shapes) and 1,510 MtCO₂ savings in 2050.
Millions of solar panels within four years
We estimated a range of 0.36–6.4 TWh of additional power generation from this stated policy aim in 2030 using the following assumptions on number of panels, capacity per panel, and capacity factor:
Capacity per panel: 0.3–0.4 kWp (California Distributed Generation Statistics 2019)
Number of panels: 1–10 million
Load hours: 1,200–1,600 (National Renewable Energy Laboratory 2020; SolarGIS 2017)
This generation would abate around 0.1–1.9 MtCO₂ in 2030 compared with the average emissions factor for electricity for 2030 in the AEO Reference Case of 290 g/kWh. In 2050, with a counterfactual emissions factor of 250 g/kWh, we estimate savings of 0.1–1.6 MtCO₂.
Tens of thousands of wind turbines, including thousands at sea, within four years
We estimated a range of 50–880 TWh onshore and 30–490 TWh offshore of additional power generation in 2030 from the wind power goals using the following assumptions on rated power per turbine, number of turbines, and capacity factor:
Capacity per turbine:
2–5 MWp onshore (Wind Europe 2020)
8–14 MWp offshore (Stromsta 2020a)
Number of turbines: 10,000–50,000 onshore, 1,000–10,000 offshore
Load hours: 2,600–3,500 onshore, 3,500 offshore (“Transparent Cost Database. Open Energy Information” 2015)
This generation would abate around 15–250 MtCO₂ onshore and 8–140 MtCO₂ offshore in 2030 compared with the average emissions factor for electricity for 2030 in the AEO Reference Case of 290 g/kWh. In 2050, with a counterfactual emissions factor of 250 g/kWh, we estimate savings of 35–215 MtCO₂ onshore and 12–120 MtCO₂ offshore, with the lower bound slightly increased under the assumption that turbines would be replaced with the largest currently available turbines at the end of their expected 25-year lifetime.
Cut carbon footprint (emissions intensity) of buildings by 50% by 2035
We estimated the current value for emissions intensity (emissions per floor space) for 2020 at around ~60 kg/m2 based on values for emissions and floor space in the commercial and residential building sectors from the EIA’s AEO 2017/2019. We then let this value reduce toward ~30 kg/m2 in 2035, that is, 50% of the 2020 value. For the period 2030–2050, we calculated a range of possible future evolutions of the intensity, either stabilizing around 24 kg/m2 toward 2050 or continuing the decarbonization trend to end at around 5 kg/m2 (Figure 15 left panel).
We then multiplied these intensity scenarios with the original AEO floor space projections to calculate emissions under the Biden plan and implied savings (Figure 15 right panel).
We find an emissions savings potential of 190 MtCO₂ in 2030 and 630–1,310 MtCO₂ in 2050.
Net-zero emissions standards for all new commercial buildings by 2030
We modeled two scenarios for this policy action. We based estimates of commercial building stock per year after 2020 on the Annual Energy Outlook 2020 values that are equivalent to lifetimes of around 85 years in 2020 rising to around 90 years by 2050. We then worked out the emissions intensity for each slice of building stock built after 2020 by creating two emissions intensity scenarios.
In Scenario 1, we simply applied a zero-emissions footprint to commercial stock built from 2030 onward. For stock built before 2030, we used their reference case emissions before 2030 and then applied their 2030 emissions intensity for years after 2030.
In Scenario 2, we assumed that commercial buildings built between 2020 and 2030 would already start to prepare for the new net-zero emissions standards by reducing their emissions intensity over time.
The resulting emissions intensity ranges are shown in Figure 16 (left panel); the final emissions for the entire new commercial stock in Figure 16 (right panel).
We find an emissions savings potential of 0–65 MtCO₂ in 2030 and 150–220 MtCO₂ in 2050.
Four million commercial retrofits and weatherization of 2 million homes within four years
To estimate the emissions impact of the two retrofit policy actions in the Biden Plan, we have made the following assumptions:
The goal of upgrading 4 million commercial buildings was interpreted as a retrofit of a full commercial building. We assumed an average floor area of ~1,560 m2 for commercial buildings based on an extrapolation of historical values from the EIA’s Building Survey (U.S. Energy Information Administration 2012). This would result in a total of 6.2 billion m2 of commercial building area being retrofitted, which is more than two-thirds of the U.S. commercial building space.
Assuming emissions savings per floor area of 30%–60% after the retrofit, results in emissions savings of 70–235 MtCO2 in 2030 and 10–180 MtCO2 in 2050 in comparison with the AEO 2020 Reference Case. The lower savings in 2050 are due to the fact that the Reference Case also assumes a gradual improvement of the building stock over time with slower retrofit rates.
The goal of weatherization of 2 million homes was interpreted as a retrofit of 2 million residential buildings (rather than individual dwellings), including multi-family buildings. We based the estimated retrofitted area on the average floor area per home in the AEO 2020 at ~1,800 m2 (U.S. Energy Information Administration 2020a).
Assuming the same emissions savings per retrofit of 30%–60%, this leads to emissions savings of 15–60 MtCO2 in 2030 and 0–40 MtCO2 in 2050 in comparison with the AEO 2020 Reference Case. The savings are much smaller than for the commercial retrofits because of the smaller area retrofitted and the lower starting emissions intensity of residential versus commercial dwellings.
The goal of weatherization of 2 million homes was interpreted as a retrofit of 2 million residential buildings (rather than individual dwellings), including multi-family buildings. We based the estimated retrofitted area on the average floor area per home in the AEO 2020 at ~1,800 m2 (U.S. Energy Information Administration 2020a).
Assuming the same emissions savings per retrofit of 30%–60%, this leads to emissions savings of 15–60 MtCO₂ in 2030 and 0–40 MtCO₂ in 2050 in comparison with the AEO 2020 Reference Case. The savings are much smaller than for the commercial retrofits because of the smaller area retrofitted and the lower starting emissions intensity of residential versus commercial dwellings.
Build 1.5 million energy efficient public homes
We use the same logic as above for the residential emissions savings, as we assume that families who move into these public homes will leave behind homes at average efficiency. This may be an overestimate as the building stock could also be considered additional to existing stock and thus the lower bound of our emissions savings estimate is set at zero.
We assume emissions savings compared with the average home of 30%–80% given that savings up to 100% are feasible, but the Biden plan seems to specify an ambition nearer 30% (US$ 500 energy bill savings compared with US$ 1,800 typical current bill) (U.S. Energy Information Administration 2018b). Note that the 30% value does not influence the final result because of the additionality considerations noted earlier.
We find an emissions savings potential from these 1.5 million homes of 0–70 MtCO₂ in 2030 and 0–50 MtCO₂ in 2050 in comparison with the AEO 2020 Reference Case.
Seal orphaned and abandoned gas wells
Our estimates for this policy action make extensive use of the values published in the scientific study by Columbia University and Resources for the Future in July 2020 (Raimi, Nerukar, and Bordoff 2020). It estimated an average of around 2 million orphaned and abandoned oil and gas wells in the United States (estimates ranging from several hundred thousand to 3 million), most of them in Pennsylvania. On average, these wells emit between 0.03 and 0.19 tonnes of methane each per year, resulting in a total emissions burden of 60 to 400 ktCH4 per year, equivalent to around 2–11 MtCO₂e.
The Biden Plan does not specify the time frame for such a program but does specify the creation of 250,000 jobs to seal wells and clean up mines. From the Columbia University study, we know that it takes around 2.4 person-years to seal 10 wells, so to seal 2 million wells would take between 2 and 4 years, depending on whether all or just half of the 250,000 workers would be deployed on the well-sealing program. Assuming that the wells can be sealed safely for at least 100 years, this means the entire emissions burden of 2–11 MtCO₂e could be eliminated by 2030 and these emissions savings would persist to 2050 and beyond.
No comments:
Post a Comment