Christopher Shaw
Quantifying power has always been central to the conduct of strategy. David Baldwin’s book Power and International Relations quoted Sir Francis Bacon who, in 1612, noted that “there is not any thing amongst civil affairs more subject to error than the right evaluation and true judgement concerning the power and forces of a state.”[1] He also quoted Stephen Jones who, more recently, stated that “so long as there is power among sovereign states, there will be estimation of power. Even though the best estimates are only rough, they are better than reliance on intuition or emotion.”[2] Both Sir Francis Bacon and Stephen Jones are correct. The need to estimate power remains central to politics, strategy and statecraft, but it continues to be a subjective and problematic undertaking.
Our ability to estimate power is improving, thanks to the insight of Professor Michael Beckley at Tufts University, who proposed a measurement of “net power” to take into account gross inputs against a state’s inherent efficiency.[3] While subjective analysis and commentary may struggle to quantify relative power between states, net power offers a more objective insight into geopolitical rivalries and great power competition. Michael Beckley went on to claim, using his concept of net power, that America is and will remain unrivaled as a geopolitical super-power.[4] Closer analysis of historical great power rivalries and net resources shows that this is an inaccurate interpretation. Instead, net resources offer an insight into the current and emerging geopolitical balance of power that indicates, while the United States will remain unsurpassed, China will represent a far more powerful competitor than America faced in the 20th century.
MEASURING POWER
A range of methodologies looking to answer questions of power and relative power has emerged in both academic, government, and military fields. The most common metric—the metaphoric Zeus of the statistical pantheon—remains a nation’s Gross Domestic Product (GDP) that captures the overall size of a nation’s economy, covering the total value of all goods and services produced in the private and public sectors.[5] Another ubiquitous metric is the Composite Index of National Capability (CINC), first defined in 1963, that attempts to define power by capturing and combining indicators of a nation’s share of demographic, industrial and military capabilities, converting this assessed strength into a single figure for comparison.[6]
Ubiquity does not automatically equate to utility, however. In the case of GDP and CINC scores, their ability to shed light on the balance of power is limited. GDP reflects economic size, not efficiency. Likewise, CINC reflects output but does not reflect systemic resilience, sustainability, or efficiency. Both GDP and CINC scores are caught in the cult of scale, rewarding mass and neglecting efficiency or agility. For example, the USSR overtook the U.S. in terms of CINC measures in the late 1960s while China’s CINC score entered parity with the United States in 2004. History indicates that the CINC metric does not reflect the reality of the balance of power in either case: the USSR would collapse in the 1990s while it still had a higher CINC score despite America remaining as the world’s only superpower; while China remains unable to deter the United States Navy from operating amidst disputed territories in the South China Sea, over a decade after China supposedly achieved parity with the United States. These are strong indications that the CINC metric either underestimates the United States or overestimates China and the Soviet Union. This conclusion is shared in academic reviews of the measures—both GDP and CINC are inconclusive and unsatisfactory as independent and stand-alone indicators, and require substantial interpretation to be of any use in analysis.
There is a better method. In 2018 Michael Beckley, a professor at Tufts University, proposed a measurement of “net power resources” to better capture a nation’s power to help “measure what matters.”[7] Beckley’s concept of power as a net resource tries to reflect that CINC and GDP scores reflect gross indicators that fail to reflect the internal costs a nation invariably incurs. Where gross power resources represent the entirety of a nation’s production without reflecting national costs, net power resources reflect what is left over after the nation deducts its internal costs and is thus available for projection or use. Beckley proposes a method of arriving at a formula for assessing a nation’s net power by building upon economic historian Paul Bairoch’s claim that the “strength of a nation could be found in a formula combining per capita and total GDP,” with the formula GDP x GDPPC (Gross Domestic Product Per Capita).[8]
In Beckley’s formula, the GDP of a nation represents its overall economic and demographic resources that can be drawn upon, or its gross resources. The GDPPC represents national efficiency, standing in as a variable that penalizes larger, inefficient populations and rewards efficient, productive populations. Beckley describes the formula as a “primitive proxy,” with the simplicity or primitive nature of the formula part of its appeal. By using commonly available data sources requiring data for a nation’s population and GDP, a net power figure can be derived for a large number of countries spanning the last few centuries.
The Utility of Net Power Resources as a Measure
One of the attractions of Beckley’s net power formula is its accessibility—the data required to conduct a range of historical, present, and even future forecasts is easily available. For historical parameters, the Maddison Project at the University of Groningen in the Netherlands has built upon the work of the late Professor Angus Maddison to attempt charting macro-scale shifts in the world’s economy. This project provides the leading collection of historical GDP and GDPPC data sources for countries back to the nineteenth century (and further, in some cases).[9]
There are some issues, however. Most of the data reflects contemporary national borders. Germany, for example, is listed as a single historical entity and is not broken into East and West Germany between 1945 and 1990. Further, some nations have only intermittent data points (GDP and population data for every decade rather than every year) in the earlier parts of the period surveyed, or, for some countries such as Russia and China, gaps exist during and into the mid-twentieth century. Even with these limitations, the Maddison Project remains the largest global economic database available for research and is widely accepted as “the main source of long-run reconstructions of economic growth used today.”[10]
Michael Beckley used the concept of net power only briefly in his book Unrivaled to show the United States significantly outmatched China under such a yardstick. His argument, that American unipolarity would endure and China and other nations would not, as his book’s title indicates, rival American supremacy in the near future, is one argument in a heavily contested field. Other arguments look on China’s rise as a potential “Thucydides’ Trap,” wherein unsatisfied rising powers will often find themselves at war with the ruling power as part of the rebalancing of the regional or global order, and it is not difficult to find references to the twenty-first century as China’s century.
With readily available historical data-sets from the Maddison Project and a more nuanced means of measuring national power, the real utility of net resources is one of comparison. It is possible to calculate the balance of net resources in both contemporary and historical contexts, moving the eternally subjective field of geopolitical power analysis to being slightly more objective.
What does net power tell us about the world today? Michael Beckley used an analysis of net power between 1990 and 2015 to show that China, even with its economic miracle, is still dwarfed by America’s net power when systemic efficiency (reflected in GDDPC) is taken into account. The figure below replicates the data set for this argument.

Net Power Resources of Select Great Powers, 1990-2015. (Author’s Work/Madison Project Database 2020)
The Maddison Project’s 2020 database allows us to extend the data forward to cover up until 2018. This time frame does not alter Beckley’s argument, with 2016-2018 continuing the previous trends and America’s net power around four times that of China’s. However, the lead is narrowing slightly: in 2013 America’s net resources were 4.7 times that of China’s, in 2015 they were 4 times that of China’s, and by 2018 they were 4.2 times that of China’s.

Net Power Resources of Select Great Powers, 1990-2018. (Author’s Work/Maddison Project Database 2020)
This would seem to echo Michael Beckley’s claim that the United States is currently unrivalled and, given current trends, will likely remain so into the immediate future. However, it is possible to compare and contrast the current balance of net power between China and America with historical great power rivalries. Figure Three shows the net power of selected great powers between 1820 and 2018, using the 2020 Maddison Project database. Given the rapid growth in American net power in the later part of the twentieth century (reflecting the economic boom of the 1950s driving American GDPPC to historically unprecedented levels) this data is better displayed as a balance of power in the second figure, depicting the proportion of net power resources accruing to each of the states shown.

Net Power Resources and Balance of Net Power Resources of Select Great Powers, 1820-2018 & (Author’s Work/Maddison Project Database 2020)
Net power modelling clearly reflects the geopolitical shift between the globally dominant powers of the United Kingdom and the United States in the late nineteenth century. What is surprising is how insignificant historical strategic competitors, including Japan and Russia/the Soviet Union, as shown in the figures below, have been relative to the United States in terms of net power. Both Japan in World War 2 and the Soviet Union in the Cold War were vastly overwhelmed in net power resources by the United States, but both nations provided a serious challenge to U.S. global primacy. This is likely attributable to how nations mobilise their net power, reflecting the fact that a nation can follow a strategy to maximise its ability to leverage its net power while minimizing its adversaries’ strategies. In 1941, for example, Japan sought to establish its own sphere of influence, replacing the U.S. as the preeminent regional power in the process.[11] Japan was a serious threat to U.S. interests in the Pacific, but it threatened neither continental America nor American interests outside the Asia-Pacific. Further, Japan effectively mobilised its entire nation behind the war effort, accepting substantial domestic deprivation to sustain their armed forces.[12] Likewise, the Soviet Union provided a substantial challenge to the American global hegemony after 1945, but only from a position of substantial net power disadvantage. The Soviet Union’s conventional military force could only seriously threaten western Europe, while the U.S. maintained a global posture.[13,14] In both cases, Japan and the Soviet Union were outclassed as strategic rivals in terms of net power, but were nonetheless able to leverage their comparatively limited net power to provide a real, tangible, and serious challenge to American interests.

Balance of Net Power Resources between the United States and Japan, 1920-1950 & Balance of Net Power Resources between the United States and the USSR, 1946-1990 (Author’s Work/Maddison Project Database 2020)
NET RESOURCES AND THE SHAPE OF THINGS TO COME
There is another dimension to net resources that can provide additional insights into geopolitical trends—the ability to use forecast population and GDP data to show how net power resources are projected to trend into the future. GDP and demographics alone tell an incomplete story in terms of geopolitical positioning. Net resources do not tell the full story of the future balance of global power, but it does provide a more nuanced view than is otherwise available through subjective analysis alone. In terms of reliability, population forecasts are reliable. World population predictions released by the United Nations Population Prospects have been conducted since 1950, and the forecast window currently extends out to 2100.[15] Historically, the United Nations Population Prospects have proven surprisingly accurate: “Projections as far back as 1950 were remarkably close to the later estimates,” one academic review noted.[16] And the surprising accuracy of historical projections should give us confidence that, although imperfect, U.N. population projections have usually turned out to be very close to the truth.”[17]
The same cannot be said for economic forecasts. The best data available is the OECD’s Real GDP Long Term Forecast, predicting national GDP levels out to 2060.[18] There are caveats worth noting on the OECD data, however. First, the forecast is based upon a baseline scenario that sees the continuation of current trends that contribute to GDPPC. This “assumes essentially no change to initial institutional and policy settings over the projection period.”[19] That is, national governments will not conduct major policy shifts that would have an impact on national GDPPC. The OECD forecast itself notes that “this approach may be said to lack realism in that tensions are allowed to accumulate (in particular fiscal pressures) or obvious reform opportunities are not seized upon.”[20] This owes something to the baselining approach taken in modelling the future and removes the variables of government reaction or change. Instead of being seen as a forecast of the future, the OECD long-term GDPPC figures are better interpreted as an extrapolation of current trends into the future. Any modelling of future net power resources is therefore less a prediction and more a forecast of current trajectories.
Further, the OECD data is more forgiving of China’s economic claims than the Maddison Project is, and likely provides a more optimistic view of the size, scale, and efficiency of the Chinese economy. The OECD long-term forecast nonetheless remains the most detailed and reputable economic forecast available (and governments use it extensively in economic planning and policy development as a result), but by its very nature it cannot be considered authoritative.[21] Economic forecasts may be intrinsically and famously unreliable, but they nonetheless remain better than relying solely on intuition or emotion. At the very least they provide an interesting insight into the impact that demographic and economic trends will have on geopolitics. And the insights are somewhat dramatic—using the U.N.’s population data and the OECD’s GDP forecast, Chinese net power is forecast to close with but not overtake that of the United States.
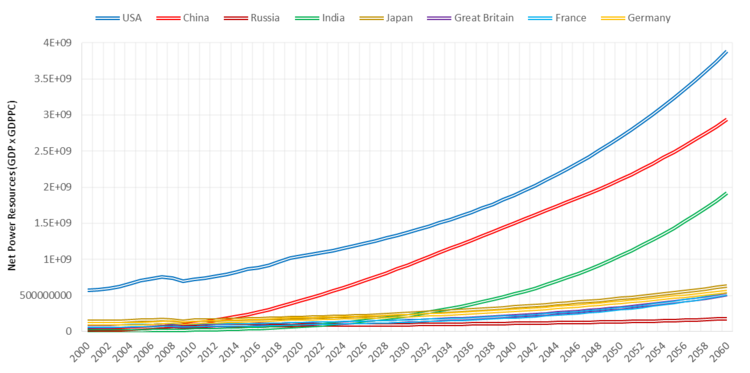
Forecast Net Power Resources of Select Great Powers, 2000-2060 (Author’s Work/U.N. Population Projection (medium fertility variant), 2019/OECD GDP Reestimate to 2060, 2020)
According to this model, China’s gradual narrowing against America’s net power resources continues until 2040, where the relative balance of net power stabilises with China’s net resources close but behind America’s. America’s net resources are not forecast to be overtaken, but this balance of power nonetheless represents a stark change from the previous decades—China will go from having 20% of the net power of the United States to a forecast 80%. There is another major change, with India breaking away from the remainder of the world’s nations from the mid-2030s to have a forecast 50% of the net power resources of the United States.
This data cannot be read as a prediction or an oracle of the future and should instead be interpreted as the extrapolation of existing trends. Even with the caveats and assumptions involved in using this data to look ahead to 2060, insights can still be gained from looking at this forecast in terms of net power resources. Turning the economic and demographic forecasts into a net power resource forecast shows that America’s share of power reduces dramatically. Even if the OECD data underpinning China’s economy is overly optimistic and the reality sees China grow closer to India’s forecast, the overall impact is only delayed and mitigated rather than averted. Either way, the global balance-of-power is forecast to be substantially different to that of the recent past. In either scenario, it is hard to see how the forecast order of the 2040s and onwards could be classified as unipolar. While it does not appear America’s position as the ruling power will change, its net power lead is forecast to narrow significantly.
Compared to previous case studies of rising and ruling powers, the Sino-American rivalry appears unique. China represents a far more potent rival power in net resource terms than Japan in World War 2 or the Soviet Union in the Cold War by a significant magnitude. China is currently equal to 24% of the total net resources of the United States, which is already well ahead of the Soviet Union’s historical ability to rival the U.S.[22,23]
In terms of net power resources, it appears that China is going to represent an unprecedented challenge to American polarity regardless of whether one uses the OECD or Maddison Project data. China can already be seen as mounting a challenge to the American-led global system as of 2020, looking to reorganize the regional economy, including joining new trade blocks that do not include the United States.[24] furthering its own trade interests outside of accepted norms such as targeting heavy sanctions against Australia,[25] establishing a separate technological infrastructure outside of American systems (such as Huawei’s 5G),[26] and redrawing supply chains and international markets via the One Belt One Road program.[27] Militarily, Beijing seeks to recast the global balance of power by modernizing and growing in areas that are often linked to power projection, including aircraft carriers, transport aircraft, and fifth-generation fighters and bombers.[28] Politically, Beijing has reordered Hong Kong’s political system against historical agreements with the international community, while remaining belligerent towards Taiwan and expanding a Chinese military presence amidst disputed territories in the South China Seas.[29,30,31] This has been conducted while China has around 25% of the net power resources of the United States, and China’s share of net power is expected to grow—the biggest question is by how much, and how quickly, dependent on how reliable the OECD assessment of China’s economic growth is. Either way, China already represents a more powerful rival than the Soviet Union in the Cold War or Japan in World War 2, and China is likely to narrow America’s net power resource lead even further in the coming decades.
It is therefore hard to support Beckley’s conclusion that the world will remain unipolar and American global power will remain unrivalled. It already appears that China is challenging the existing global order led by the United States, indicating the desire to reorder the balance of power. China is behaving like a rival to the United States, having a greater balance of net power resources than historical challengers to America have had in the past. India’s current trajectory further alters changes to the geopolitical picture. If the world can currently be viewed as increasingly bipolar with a rising China, India’s rise will create a more multipolar balance of power than Beckley forecast.
CONCLUSION
An analysis of net power resources indicates that China already has a significantly greater net power base than previous rivals to America did in the 20th Century, and an analysis of demographic and economic trends indicates that America’s lead in net power is forecast to decrease further out to 2060. In net power terms, America faces a substantial geopolitical challenge given Beijing’s intentions combined with the current and forecast strength of China, and India is forecast to become a more significant power. China is unlikely to equal or exceed America’s net power and looks set to remain a distant second to the United States, but historical case-studies indicate that a close or closing balance in net power resources is not needed for a nation to represent a serious challenge to the ruling power.
Beckley’s argument that American unipolarity will persist for many decades is therefore unlikely to hold true, based on an analysis of great power rivalries using his own concept of net power resources. While Beckley believed “we are living in the unipolar era, and that it will outlive us,” he failed to account for how rising and rival powers can challenge a ruling power, even when substantially overmatched by the ruling power’s net resources.[32] It is accepted that Japan and the Soviet Union were serious great power rivals to America’s status as the ruling power in the twentieth century, and both challenged the United States while vastly overmatched in net power resources.
Beckley correctly noted that his formula for a net power resource was only a primitive proxy in assessing a nation’s power that could not be held up as anything other than a rough indicator. However, as Baldwin noted, while indicators may be only rough, they remain better than reliance on intuition or emotion. Net resources offer an additional insight into historical, present, and future trends of the global balance of power, enhancing and expanding our understanding of great power politics and competition. They can be a modern-day oracle—imperfect and imprecise, but nonetheless useful. As one scholar evaluating metrics and power transitions noted, “These are not merely lofty conceptual problems or troubles of long past historical cases, but are extremely relevant for our time and immediate future.”[33] The concept of net power resources and what it indicates is relevant, and deserves closer analysis by those wishing to understand the topography of past, present and future geopolitical challenges.
No comments:
Post a Comment