


By Aude Fleurant
This SIPRI Fact Sheet lists the top 100 arms-producing and military services companies in 2015 and describes the international arms sales trends that unfolded during the year. Although there was a slight decrease in arms sales revenues when compared to the previous year, profits in 2015 were still 37 per cent higher than in 2002, when SIPRI began recording such data.
KEY FACTS
The arms sales of the SIPRI Top 100 arms-producing and military services companies (excluding China) were $370.7 billion in 2015. This represents a decrease of 0.6 per cent compared with 2014 and is the fifth consecutive year of decline.
US-based companies’ arms sales for 2015 fell by 2.9 per cent to $209.7 billion, due to ongoing limitations on government spending, including military spending. However, with a 56.6 per cent share of the Top 100 arms sales in 2015, US companies’ arms revenues remain way ahead of those of other countries.
Following five consecutive years of declining sales, West European Top 100 arms producers’ sales increased by 6.6 per cent to $95.7 billion in 2015. With combined sales of $21.4 billion, the six French companies listed in the Top 100 increased their arms sales by 13.1 per cent, helping to drive regional arms sales growth.
South Korean companies in the Top 100 increased their arms sales by 31.7 per cent in 2015 to a total of $7.7 billion, reflecting growing domestic military procurement and rising export sales.
Growth in the Russian arms industry continued in 2015. The combined arms sales for Russian companies in the Top 100 totalled $30.1 billion, a 6.2 per cent rise compared with 2014. However, this growth rate is substantially lower than the 48.4 per cent increase recorded between 2013 and 2014.
Sales of the world’s 100 largest arms-producing and military services companies totalled $370.7 billion in 2015 (see table 1). Compared with 2014, this is a slight decline of 0.6 per cent (figures exclude China, see box 1).1 While this continues the downward trend in arms sales that began in 2011, it signals a significant slowdown in the pace of decline. However, despite the decrease, Top 100 arms sales for 2015 are 37 per cent higher than those for 2002, when SIPRI began reporting corporate arms sales (see figure 1).
1 Unless otherwise specified, all changes are expressed in real terms or constant terms (not current or nominal); ‘sales’ refers to sales of military equipment and services; sales are for only those ranked companies.
Figure 1. Total arms sales of companies in the SIPRI Top 100, 2002–15
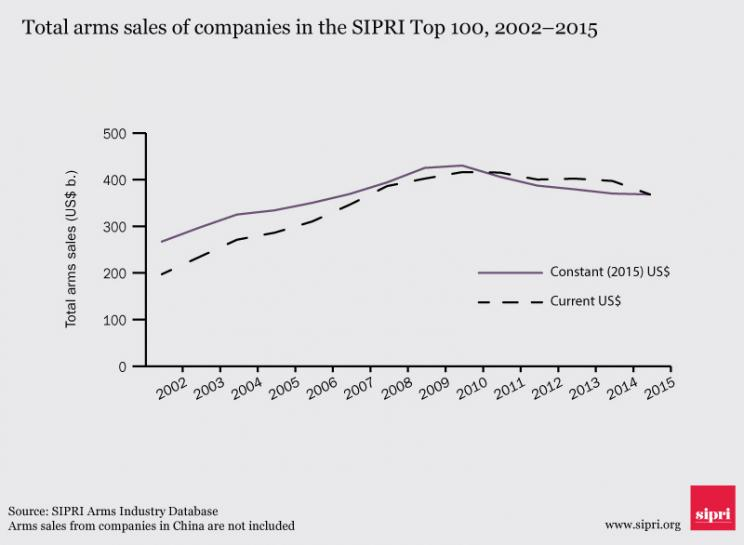
Notes: The data in this graph refers to the companies in the SIPRI Top 100 in each year, which means that it refers to a different set of companies each year, as ranked from a consistent set of data. ‘Arms sales’ refers to sales of military equipment and services to armed forces and ministries of defence worldwide. For a full definition see or SIPRI Yearbook 2016.
DEVELOPMENTS IN THE TOP 100
Companies headquartered in the United States and Western Europe have dominated the list of Top 100 arms-producing and military services companies since 2002. And, true to form, this was the case for 2015: with sales reaching $305.4 billion, companies based in the USA and Western Europe accounted for 82.4 per cent of the Top 100 arms sales. The modest 0.6 per cent decrease in Top 100 sales compared with 2014 is primarily due to a decrease of 2.9 per cent in the revenues of US-based companies, which show a decline for the fifth consecutive year, with $209.7 billion in arms sales for 2015 compared with $215.6 billion in 2014 (see figure 2). While sales in the USA decreased, there was a noteworthy rise in arms sales of West European producers, which grew by 6.6 per cent in 2015 to reach $95.7 billion compared with $89.7 billion in 2014.
Figure 2. Percentage change in arms sales of companies in the SIPRI Top 100, by country, 2014-15
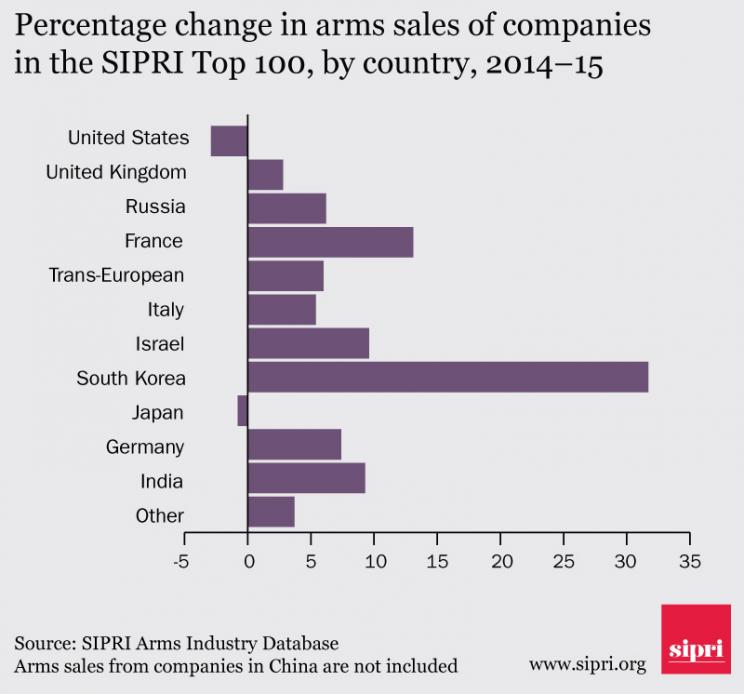
Notes: The change refers to the companies in the Top 100 for 2015. The figures are based on arms sales in constant (2015) US$. The category ‘Other’ consists of countries whose companies’ arms sales comprise less than 1% of the total: Australia, Brazil, Finland, Norway, Poland, Singapore, Sweden, Switzerland, Turkey and Ukraine.
The top 10 companies in the SIPRI Top 100 are exclusively headquartered in the USA and Western Europe. With combined arms sales of $191.4 billion, the 10 largest companies represent 51.6 per cent of the total sales of the Top 100 in 2015, compared with 49.5 per cent in 2014. The increase in share of the top 10 companies can be attributed to a modest growth in arms sales for several companies, and for US companies, the strength of the US dollar. Despite this slight rise, the share of the top 10 arms companies’ sales in the Top 100 has been generally decreasing from approximately 60 per cent of the Top 100 total arms sales in 2002 to approximately 50 per cent in more recent years. This is due to the increasing role of Russian and emerging producers.
With combined sales of $30.1 billion for 2015, the Russian companies ranked in the Top 100 represent an 8.1 per cent share of the total. Sales in 2015 increased by 6.2 per cent over 2014, which is significantly slower than the 48.4 per cent growth rate between 2013 and 2014. The continued growth underlines the Russian Ministry of Defence’s commitment to fund military procurement despite the economic difficulties experienced by the country since 2014.
Companies in the ‘other established’ and ‘emerging’ producers categories account for 9.5 per cent of the Top 100 arms sales with a combined total of $34.5 billion.2 This represents an increase of 3.0 per cent for other established producers and a rise of 15.9 per cent for emerging producers. The significant expansion in the arms sales of emerging producers is mostly attributable to South Korean companies, which increased their sales by 31.7 per cent in 2015.
2 SIPRI introduced the ‘other established’ and ‘emerging’ producers categories in the 2013 edition of the SIPRI Top 100 Fact Sheet. The other established producers category covers companies based in 6 countries (i.e. Australia, Israel, Japan, Poland, Singapore and Ukraine) that have mature and sometimes significant arms-producing capabilities but are not looking to develop their capabilities further. The companies in the emerging producers category are based in 4 countries (i.e. Brazil, India, South Korea and Turkey) that have stated objectives with regard to building significant indigenous arms-production capabilities and achieving some greater level of self-sufficiency in arms procurement.
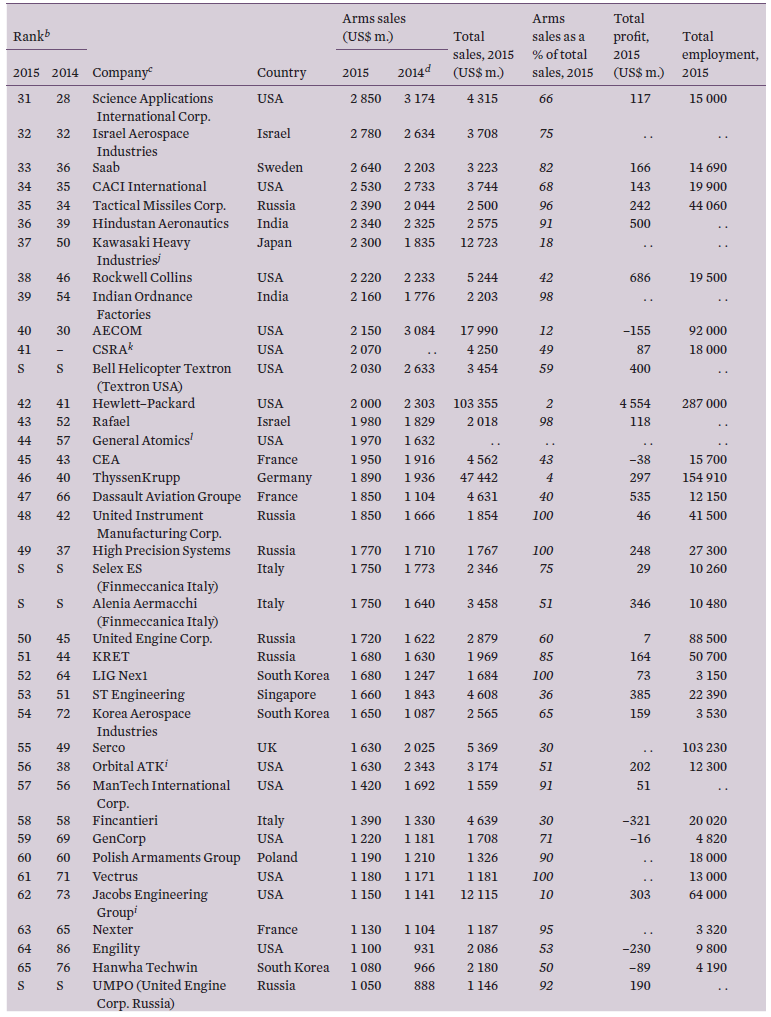
Table 1. The SIPRI Top 100 arms–producing and military services companies in the world excluding China, 2015a
Figures for arms sales, total sales and profit are in millions of US$. Dots (. .) indicate that data is not available.
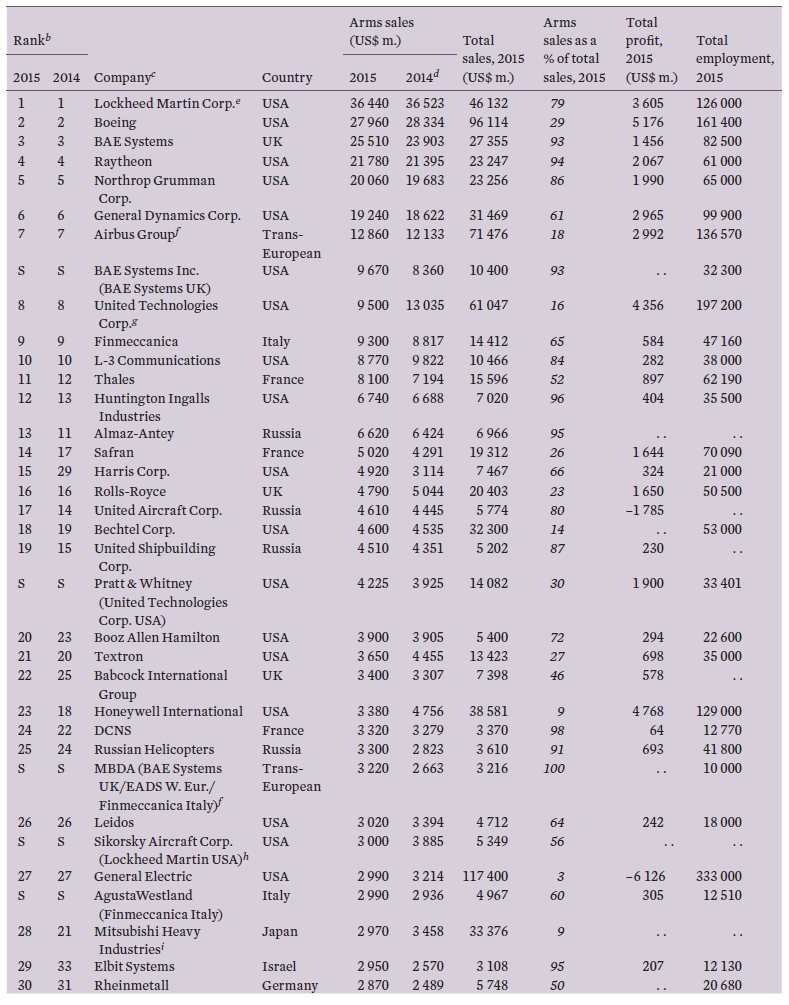
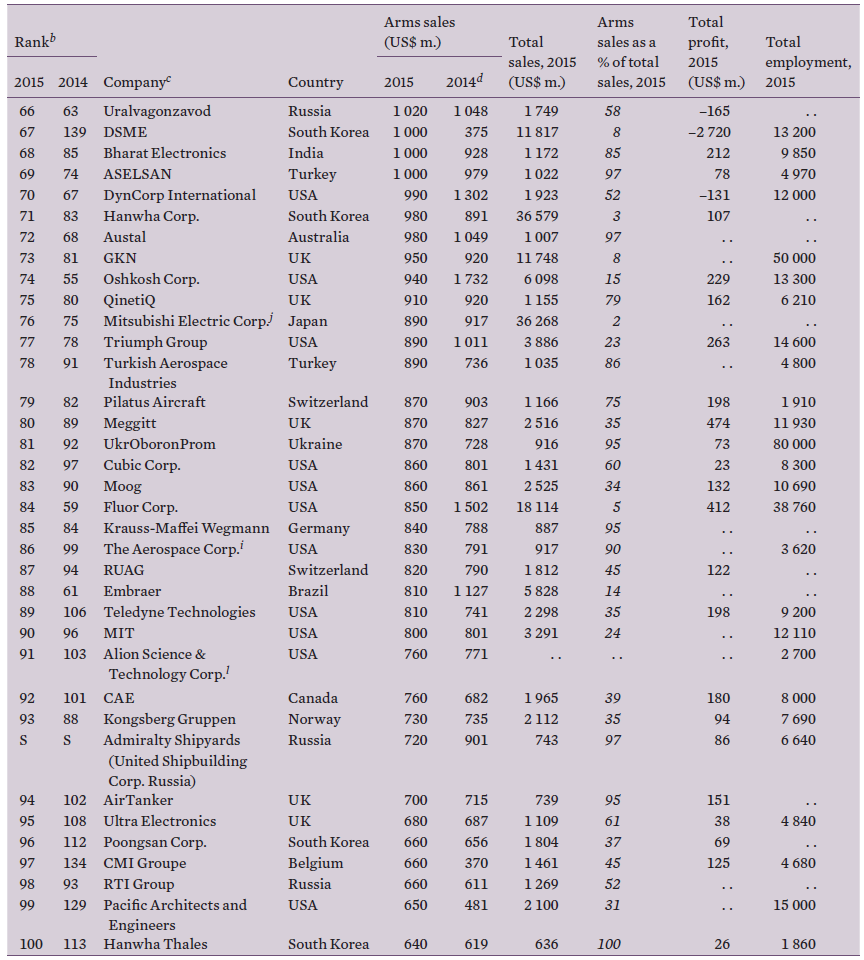
a Although several Chinese arms-producing companies are large enough to rank among the SIPRI Top 100, it has not been possible to include them because of a lack of comparable and sufficiently accurate data.
b Companies are ranked according to the value of their arms sales in 2015. An S denotes a subsidiary company. A dash (–) indicates that the company did not rank among the SIPRI Top 100 for 2014. Company names and structures are listed as they were on 31 Dec. 2015. Information about subsequent changes is provided in these notes. The 2014 ranks may differ from those published in SIPRI Yearbook 2016 and elsewhere owing to continual revision of data, most often because of changes reported by the company itself and sometimes because of improved estimations. Major revisions are explained in these notes.
c For subsidiaries and operational companies owned by another company, the name of the parent company is given in parentheses along with its country. Holding and investment companies with no direct operational activities are not treated as arms-producing companies, and companies owned by them are listed and ranked as if they were parent companies.
d Figures for previous year arms sales—i.e. a company’s arms sales in 2014—are presented in constant 2015 US$, so as to be better comparable with the figures for arms sales in the current year, i.e. 2015. In previous editions of the SIPRI Yearbook and Top 100 lists, previous year arms sales were presented in current US$.
e Lockheed Martin acquired helicopter producer Sikorsky from United Technologies on 5 Nov. 2015, and included Sikorsky’s sales in its turnover for the period 6 Nov. 2015 to 31 Dec. 2015.
f Trans-European refers to companies whose ownership and control structures are located in more than one European country.
g United Technologies Corporation sales include Sikorsky’s sales from 1 Jan. 2015 to 5 Nov. 2015.
h Sales figures for Sikorsky cover the whole of 2015.
i Arms sales figures for these companies are estimates and are subject to a high degree of uncertainty.
j Arms sales for these companies are based on annual contract values from the Japanese Ministry of Defense.
k CSRA is a new company formed following Computer Science Corp.’s divestment of its government services activities. After the divestment, the resultant company merged with SRA International to create CSRA. As Computer Science Corp. no longer receives revenues from arms sales it is not listed in the SIPRI Top 100 for 2015.
l Sales figures for these companies are based on data on US prime contract awards as recorded by USAspending.gov. These figures may be underestimated because awards from classified (secret) US contracts and some exports are not included in this data.
NATIONAL DEVELOPMENTS
The United States
The USA accounted for the largest share of the arms industry Top 100 in 2015: it ranked 39 companies (7 of which are in the top 10) and accounted for 56.6 per cent of the total (see figure 3). This reflects the fact that the US Department of Defense is the largest single military spender, and it awards a very large proportion of its contracts to companies based in the country. Decreases in turnovers of US-based arms companies and the companies’ mixed results for 2015 reflect persistent constraints on military spending caused by legally required spending caps enacted in 2010, as well as delays in deliveries of major platforms (such as the F-35) and the strength of the US dollar (which has negatively affected export sales).
In 2015, three new US companies entered the Top 100: CSRA (41), Engility (64) and Pacific Architects and Engineers (PAE) (99). All three are ‘pure’ services companies that were divested from larger arms companies—Computer Science Corporation, L-3 Communications and Lockheed Martin, respectively—following the drop in demand for services after the drawdown of large US military operations in Afghanistan and Iraq. After the companies began operating as independent entities in the first half of the 2010s, they acquired other small- and medium-sized services companies. Through these consolidations, CSRA and PAE have built up sufficient revenues to enter the Top 100 in 2015. Engility’s inclusion in the Top 100 is based on recently discovered data. Engility has, in fact, had sufficient revenue to rank in the Top 100 since 2012, and the SIPRI data series has been updated to reflect this.
France, Germany, Sweden and the United Kingdom
The combined arms sales of the six French companies listed in the Top 100 totalled $21.4 billion in 2015—a rise of 13.1 per cent compared with 2014. This increase has acted as an important driver for the recent growth in arms sales in Western Europe. The upturn is mostly due to a 67.5 per cent surge in arms sales for Dassault Aviation Group, which produces the Rafale combat aircraft, following deliveries to Egypt and payment for future deliveries by Qatar. The regional figure is also lifted by sales increases for Thales (up 12.6 per cent) and Safran (up 17 per cent), which produces several subsystems and parts of the Rafale, such as aircraft engines.
The three German companies ranked in the Top 100 in 2015 boosted their combined arms sales ($5.6 billion) by 7.4 per cent over the previous year. The increase is slightly smaller than the one observed in 2014 and is largely the result of a 15.3 per cent growth of Rheinmetall’s sales. Sweden’s sole Top 100 company, Saab, showed a 19.8 per cent increase in its arms sales, partly due to the acquisition of submarine shipyard Kockums in 2014. British companies reversed the downward trend recorded in 2014 with a 2.8 per cent rise in their arms sales. Out of the nine British companies ranked, four showed an increase, the most significant one being BAE Systems with 6.7 per cent growth in 2015, following deliveries of Typhoon combat aircraft to Saudi Arabia and improved results for the company’s naval activities.
Figure 3. Share of arms sales of companies in the SIPRI Top 100 for 2015, by country
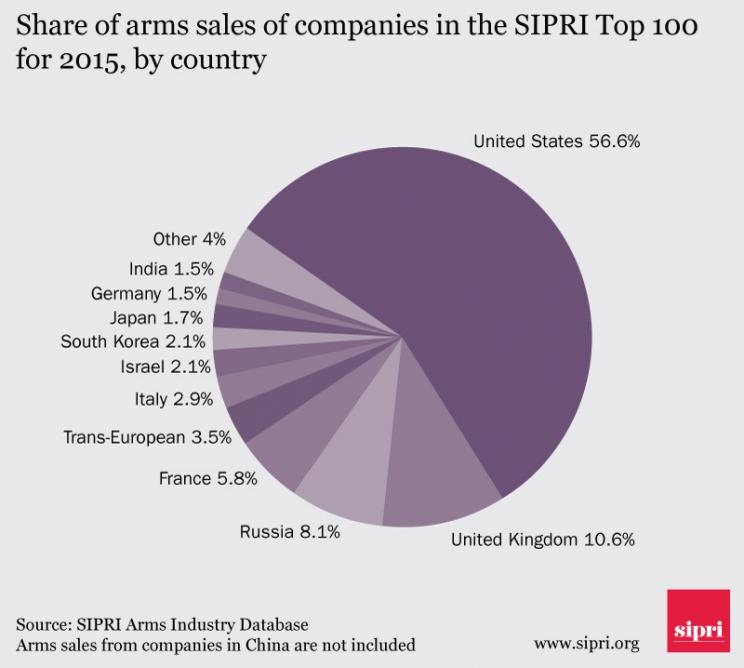
Notes: The Top 100 classifies companies according to the country in which they are headquartered, so sales by an overseas subsidiary will be counted towards the total for the parent company’s country. The Top 100 does not include the entire arms industry in each country covered, only the largest companies. The category ‘Other’ consists of countries whose companies’ arms sales comprise less than 1% of the total: Australia, Brazil, Finland, Norway, Poland, Singapore, Sweden, Switzerland, Turkey and Ukraine.
Figures do not always add up to a total of 100% because of the conventions of rounding.
Russia
The combined sales of the 11 Russian companies ranked in the Top 100 reached $30.1 billion in 2015, an increase of 6.2 per cent compared to 2014. This growth was led by rising sales for Russian Helicopters (up 16.9 per cent) and Tactical Missiles (also up 16.9 per cent) due to large investments in weapon acquisitions by the Russian Ministry of Defence and some important export sales during the year. The upturn in sales is partly explained by Russia’s efforts to modernize its armed forces’ equipment and capabilities through domestic military procurement. However, all of the Russian companies in the SIPRI Top 100 for 2015 are ranked lower than they were in 2014—even when 10 out of 11 saw an increase in sales. The lower rankings are mostly attributable to the fall of the Russian rouble during 2015.
Emerging Producers
The 2015 sales of the seven South Korean companies ranked in the Top 100 totalled $7.7 billion and amounted to a combined increase of 31.7 per cent compared with 2014. This large upsurge is mostly due to LIG Nex1’s increase of 34.7 per cent compared with 2014, and Korea Aerospace Industry’s 51.7 per cent increase in turnover. Three companies that were not listed in the 2014 Top 100 are ranked in 2015: Poongsan, DSME and Hanwha Thales. All South Korean companies showed higher arms sales in 2015, reflecting the South Korean Ministry of Defense’s increasing commitment to domestic procurement as well as ongoing success in the international market.
Box 1. Chinese arms-producing companies
Chinese companies are not covered by the SIPRI Top 100 due to the lack of data on which to make a reasonable estimate of arms sales for most companies. Nonetheless, some information is available on the 10 major state-owned conglomerates under which most of the Chinese arms industry is organized.
Based on the overall industry picture and on limited information on individual companies, at least 9 of these 10 companies would almost certainly be in the Top 100 if figures for arms sales were available. Of these, 4 to 6 would probably be in the top 20, and 2 (the aircraft producer AVIC and the land system producer Norinco) may be in the top 10.
China’s military spending increased more than fivefold in real terms between 2000 and 2015, and the country has engaged in major efforts to develop its domestic industry. In addition, China’s arms exports have grown substantially in the past decade.
Indian (up 9.3 per cent) and Turkish companies (up 10.2 per cent) also saw robust growth in 2015, based on strong domestic demand for both countries and some exports for Turkey. Embraer, the sole Brazilian company ranked, showed a 28.1 per cent decline in its arms sales in 2015—possibly due to large public spending cuts in the context of an economic crisis, reducing state orders for defence equipment.
Other Established Producers
Four of the six countries identified as other established producers (Australia, Japan, Poland, Singapore) displayed decreases in their arms sales in 2015. Of the 10 companies in the category, Singapore’s ST Engineering showed the most significant decline with a 9.9 per cent drop due to a reduction in domestic demand for the company’s products. In contrast, Ukraine’s UkrOboronProm showed the largest rise in arms sales with 19.6 per cent. The increase reflected three developments: the impact of the acquisition of Antonov (the last independent major arms producer in Ukraine); large sales of military vehicles, ammunition, and communications and electronic equipment, primarily for the Ukrainian Ministry of Defence; and large increases in Ukraine’s military expenditure resulting from the conflict in its eastern region.
About the Authors
Dr Aude Fleurant (Canada/France) is Director of the SIPRI Arms and Military Expenditure Programme.
Dr Sam Perlo-Freeman (United Kingdom) is a Senior Researcher and the Head of the SIPRI Military Expenditure Project.
Pieter D. Wezeman (Netherlands/Sweden) is a Senior Researcher with the SIPRI Arms and Military Expenditure Programme.
Siemon T. Wezeman (Netherlands) is a Senior Researcher with the SIPRI Arms and Military Expenditure Programme.
Noel Kelly (Ireland) is Programme Coordinator for the SIPRI Arms and Military Expenditure Programme.
No comments:
Post a Comment