


Key Facts
World military expenditure was $1686 billion in 2016, an increase of 0.4 per cent in real terms.
Total military spending accounted for 2.2 per cent of the global GDP in 2016.
The five biggest spenders in 2016 were the USA, China, Russia, Saudi Arabia and India.
Military expenditure increased in Asia and Oceania, Europe (Central, Eastern and Western) and North America.
Military spending decreased in Africa, Central America and the Caribbean, and South America.
Of the countries in the Middle East for which data is available, total military expenditure fell by 17 per cent; the major decreases were in Iraq (–36 per cent) and Saudi Arabia (–30 per cent).
Military expenditure in the USA grew by 1.7 per cent to $611 billion in 2016, the first increase after five consecutive years of decline. Despite this slight increase, US military spending remains 20 per cent lower than the peak of 2010.
The fall and continued slump in world oil prices has had a substantial effect on military spending in a majority of oil-export dependent countries. In many cases (e.g. Saudi Arabia, South Sudan and Venezuela), country-specific cuts have been so substantial that they have affected regional and subregional spending trends.
World military expenditure is estimated to have been $1686 billion in 2016, equivalent to 2.2 per cent of the global gross domestic product (GDP) or $227 per person.1 The 2016 estimate is a marginal increase of about 0.4 per cent in real terms on 2015.2 After 13 consecutive years of increases (from 1998 to 2011), world military spending has continued to plateau—with only minor decreases between 2011 and 2014 (an average of 0.7 per cent per annum) and slight increases in 2015 and 2016 (see figure 1).3
In many oil-exporting countries, increases in military spending over the past 10 years have been correlated with high oil prices. The subsequent fall in the price of oil has led to substantial decreases in military spending. Since late 2014, the sharp fall in oil prices and the persistent price slump have had a significant impact on spending in several oil-exporting countries. The decline in oil revenue has forced many oil-exporting countries to cut their government budgets, including military spending. The falls in countries such as Angola, Ecuador, Iraq, Mexico, Saudi Arabia, South Sudan and Venezuela have affected the wider regional trends.
Figure 1. World military expenditure, 1988–2016
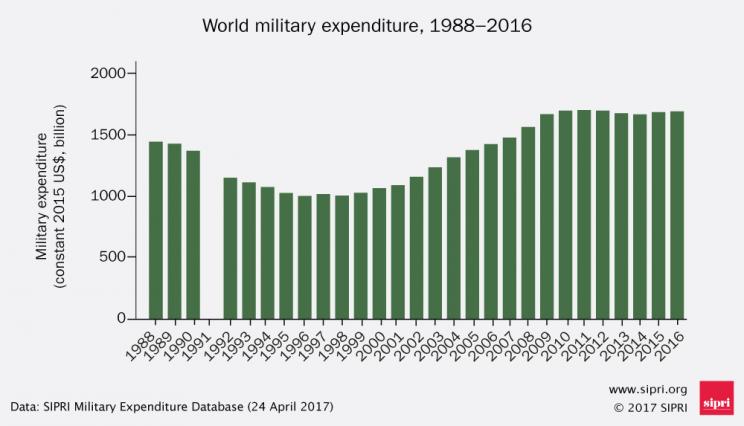
Note: The totals are based on the data on 172 states in the SIPRI Military Expenditure Database, . The absence of data for the Soviet Union in 1991 means that no total can be calculated for that year.
The Top 15 Military Spenders In 2016
The top 15 countries with the highest military spending in 2016 were the same as those in 2015, although there were some changes in their ranking (see table 1). The 15 largest spenders account for $1360 billion, or 81 per cent, of total global spending. Between 2007 and 2016, China has seen the biggest growth in military spending, with an increase of 118 per cent, followed by Russia (87 per cent) and India (54 per cent). In the same period, Italy (–16 per cent), the United Kingdom (–12 per cent) and the United States (–4.8 per cent) were the only countries in the top 15 to see their military expenditure fall.
Table 1. The 15 countries with the highest military expenditure in 2016
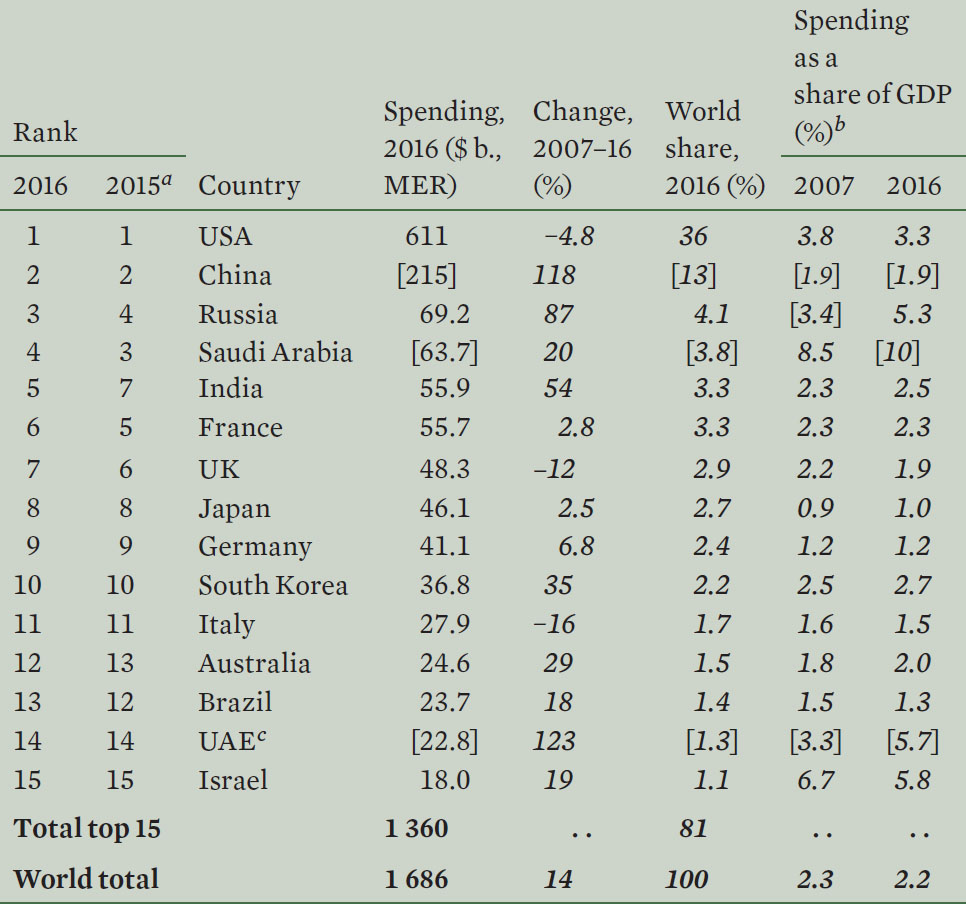
Spending figures are in US$, at current prices and exchange rates. Figures for changes are calculated from spending figures in constant (2015) prices. Figures may not add up to displayed totals due to the conventions of rounding.
[ ] = SIPRI estimate; GDP = gross domestic product; MER = market exchange rates; UAE = United Arab Emirates.
a Rankings for 2015 are based on updated military expenditure figures for 2016 in the current edition of the SIPRI Military Expenditure Database. They may therefore differ from the rankings for 2015 given in the SIPRI Yearbook 2016 and in other SIPRI publications in 2016. Countries are ranked according to military spending calculated using market exchange rates (MER).
b The figures for military expenditure as a share of gross domestic product (GDP) are based on estimates of 2016 GDP from the International Monetary Fund (IMF) World Economic Outlook and International Financial Statistics database, Oct. 2016.
c The figures for the UAE are for 2014, as no data is available for 2015 and 2016. The percentage change is from 2007 to 2014.
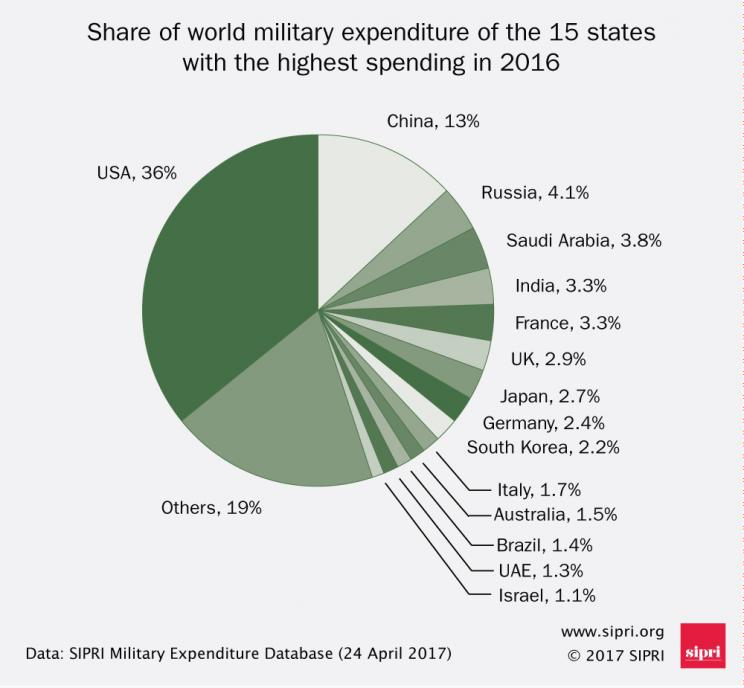
In 2016, total US military expenditure of $611 billion is over one-third (36 per cent) of world military expenditure. This is nearly three times the level of China’s spending, which is ranked second (see figure 2). US military spending grew by 1.7 per cent between 2015 and 2016, the first increase after five consecutive years of decline. Despite this slight growth, US military spending remains 20 per cent lower than its peak in 2010. The small upturn in 2016 can be attributed to legislation adopted in 2013 and 2015, which eased the budget limits imposed in 2011. However, given the context of the presidential election and the inability of the US Congress and the White House to reach agreement on a budget to be implemented on 1 October 2016, there is uncertainty about short-term developments in the country’s military expenditure.
As a result of an unexpected increase in Russia’s military expenditure in late 2016 and large cuts to Saudi Arabia’s military budget, Russia moved above Saudi Arabia to the position of third largest spender in 2016. India moved from 7th to 5th place after its largest annual spending increase since 2009. Meanwhile, both the UK and Brazil dropped one place in the rankings. The UK fell from 6th to 7th—a move largely attributed to the devaluation of the British pound following the result of a referendum on the country’s membership of the European Union. In Brazil, which went from 12th to 13th position, failure to revitalize an economy deep in recession has seen the country’s military spending decline by 7.2 per cent.
Regional Trends4
Figure 2. The share of world military expenditure of the 15 states with the highest spending in 2016
Military expenditure in North America saw its fi rst annual increase (1.7 per cent) since 2010. Central, Eastern and Western Europe also recorded annual increases of 2.4, 3.5 and 2.6 per cent, respectively (see fi gure 3). Asia and Oceania’s spending rose by 4.6 per cent in 2016. By contrast, military spending fell in Central America and the Caribbean (–9.1 per cent), South America (–7.5 per cent), Africa (–1.3 per cent) and the total of countries in the Middle East for which data is available.
Figure 3. Changes in military expenditure, by region, 2015–16

Note: Military expenditure data for the Middle East in 2016 is highly uncertain. An estimate for the Middle East is included in the estimated world total.
Africa
Military expenditure in Africa as a whole fell by 1.3 per cent to $37.9 billion in 2016 (see table 2). This was the second year of decrease after 11 consecutive years of increases dating back to 2003. Total spending in Africa, however, is still 48 per cent higher than it was in 2007.
Table 2. Military expenditure in Africa
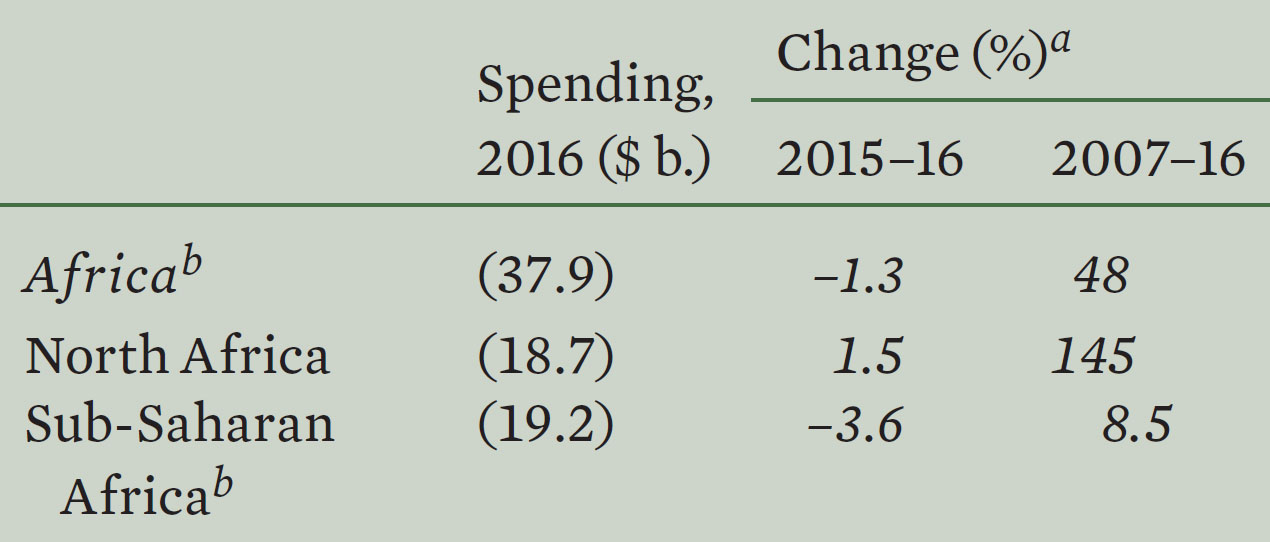
( ) = uncertain estimate.
a Changes are in real terms.
b Total excludes Eritrea and Somalia.
Military expenditure in North Africa continues to rise. The total in 2016 of $18.7 billion is an increase of 1.5 per cent compared with 2015 and is 145 per cent higher than in 2007. Algeria, Africa’s largest spender, increased its military expenditure by 2.3 per cent over 2015, a much lower level of increase than any other year since 2007. This slowdown in growth came at a time when low oil prices were having a major effect on Algeria’s public finances.
By contrast, spending in sub-Saharan Africa decreased by 3.6 per cent. Cuts in spending by South Sudan and Angola drove this trend. Faced with severe economic problems due to falling oil revenues, military spending in South Sudan decreased by 54 per cent, while Angola’s spending fell by 10 per cent to levels not seen since 2006.
Despite the numerous ongoing conflicts in sub-Saharan Africa, increases in military spending by countries in conflict were substantially lower than in 2015. For example, in the Democratic Republic of the Congo, military expenditure rose by only 2.4 per cent, following a 43 per cent increase in 2015, even though civil conflicts continue in parts of the country. Amid Mali’s continuing peacebuilding efforts and fight against armed Islamist extremists, the country increased its military expenditure by 18 per cent in 2016. While this is the second highest increase in sub-Saharan Africa, it is much lower than the country’s 67 per cent increase in 2015.
Botswana had the highest percentage increase in military spending between 2015 and 2016 of any country in Africa. Despite it being in one of the least conflict-prone areas of sub-Saharan Africa and one of the few African countries to have never been involved in an armed conflict, Botswana’s spending grew by 40 per cent or $152 million in 2016. This is reported to be part of Botswana’s military modernization programme. Military expenditure in Nigeria increased by only 1.2 per cent to $1.7 billion in 2016, despite its large-scale military operations against Boko Haram. Corruption allegations linked to military procurement, however, continue to raise questions about the reliability of the country’s published figures.
Americas
Military expenditure in the Americas increased by 0.8 per cent in 2016 to $693 billion—still 4.4 per cent lower than in 2007 (see table 3). Expenditure in North America (Canada and the USA) was $626 billion in 2016, accounting for 90 per cent of total spending in the region. North America’s total is 1.7 per cent higher compared with 2015 and 4.8 per cent lower than in 2007. Spending in South America continues to decrease following its peak in 2013, while spending in Central America and the Caribbean fell for the first time since 2003. Total spending in these two subregions was $66.6 billion, down 7.8 per cent compared with 2015 and at the same level as in 2007.
Table 3. Military expenditure in the Americas
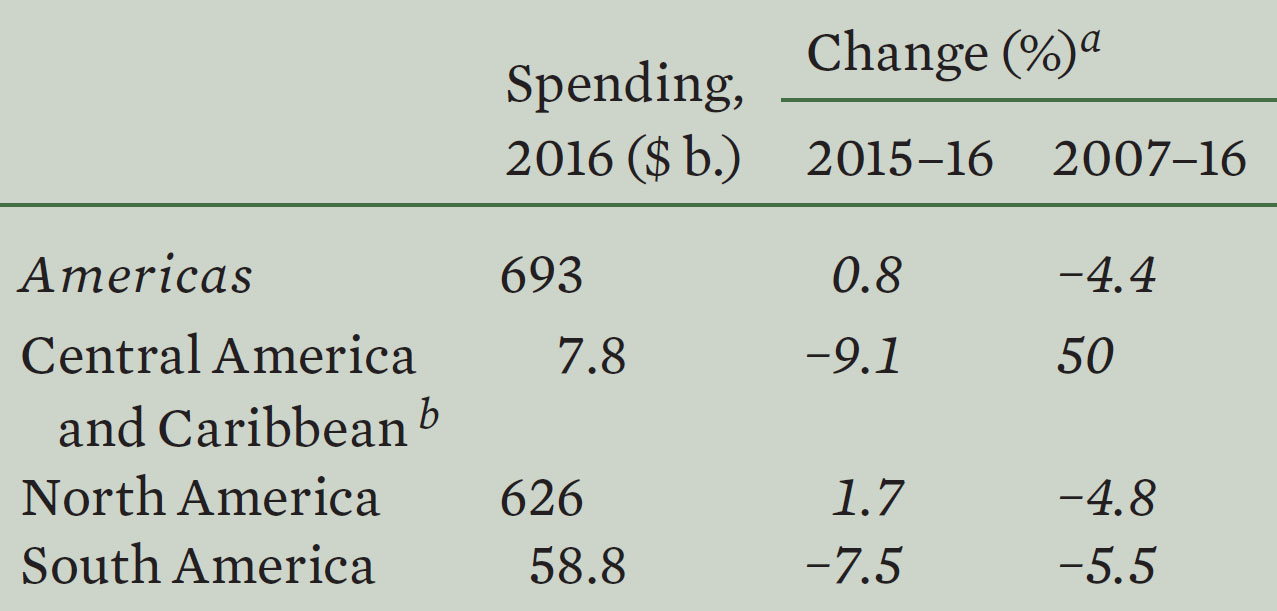
a Changes are in real terms.
b Total excludes Cuba.
The fall in military expenditure in South America (–7.5 per cent) can mainly be attributed to the benign security environment, the deepening impact of the fall in oil prices on oil-exporting countries and economic problems in Brazil. Venezuela, plunged into economic chaos by falling oil prices, cut its military spending by $2.9 billion (–56 per cent) compared with 2015, which accounts for 68 per cent of the total decrease in the subregion. Similarly, as government revenues from oil exports shrink, Ecuador and Peru have also reduced their military spending by 13 and 20 per cent, respectively. Brazil, the region’s largest spender, has seen a worsening recession, leading to further cuts in the military budget of 7.2 per cent. While many of the major military spenders in South America cut their budgets in 2016, there was a substantial increase in Argentina (12 per cent) and Colombia (8.8 per cent).
In Central America and the Caribbean, changes in military expenditure are largely driven by Mexico, which accounts for 77 per cent of the sub region’s spending. Military spending in Mexico has increased in recent years due to its use of military force against drug cartels, but 2016 marked the first annual decrease in military spending (–11 per cent) since 2004. The persistent global context of low oil prices and high government debt was highlighted by the Mexican Government’s proposal to make budget cuts of $13.1 billion in 2016 and a further $12.9 billion in 2017. In this context, it is highly likely that Mexico’s military spending will continue to decrease in the coming years.
Asia and Oceania
Military spending in Asia and Oceania amounted to $450 billion in 2016, an increase of 4.6 per cent on 2015 (see table 4). This is a slightly lower rate of growth than in the previous two years. This lower rate is partially related to the slowdown in the growth of Chinese military spending, which has historically tracked China’s GDP growth. Regional spending increased by 64 per cent between 2007 and 2016, and all but three countries increased their spending. Between 2015 and 2016, military expenditure grew in all subregions, ranging from a 1.7 per cent increase in Oceania to a 6.4 per cent increase in Central and South Asia. Between 2007 and 2016, East Asia had the largest increase of all subregions, raising spending by 74 per cent.
Table 4. Military expenditure in Asia and Oceania
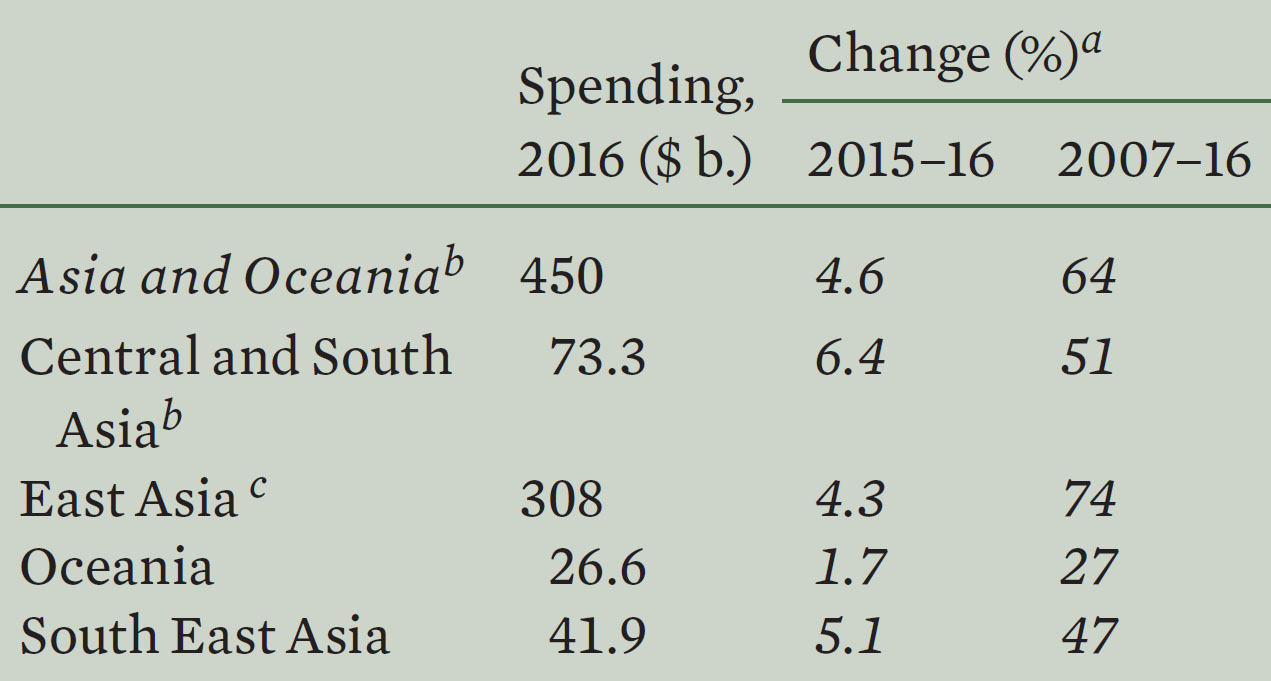
a Changes are in real terms.
b Total excludes North Korea, Turkmenistan and Uzbekistan.
c Total excludes North Korea.
Five of the top fifteen global spenders in 2016 are in Asia and Oceania: China, India, Japan, South Korea and Australia (in ranked order). China had by far the highest military spending in the region: an estimated $215 billion, or 48 per cent of regional spending. This amount is almost four times that of India’s total, which is the second largest in the region at $55.9 billion.
There are many ongoing tensions in the region: in the Korean Peninsula, between North Korea and South Korea; between China and Japan, over claims in the East China Sea; between China and several South East Asian countries, over claims in the South China Sea; between India and Pakistan; and between India and China. Such tensions help governments to continue to justify the need to modernize their military capabilities, and to drive military spending upwards. On the other hand, economic growth in the region has generally continued, even if sometimes at a lower rate than in previous years, which makes it possible to increase military spending without increasing the military burden on the economy (i.e. its percentage of the GDP). Almost all the countries in the region have kept their military spending as a percentage of GDP at the same level since 2012.
Europe
At $334 billion in 2016, Europe’s military spending accounted for 20 per cent of global military expenditure. The figure is an increase of 2.8 per cent compared with 2015 and is only 5.7 per cent higher than in 2007. Spending increased in all subregions: Central and Eastern Europe’s military expenditure increased by 2.4 and 3.5 per cent, respectively, in 2016, while in Western Europe spending rose by 2.6 per cent (see table 5).
Table 5. Military expenditure in Europe
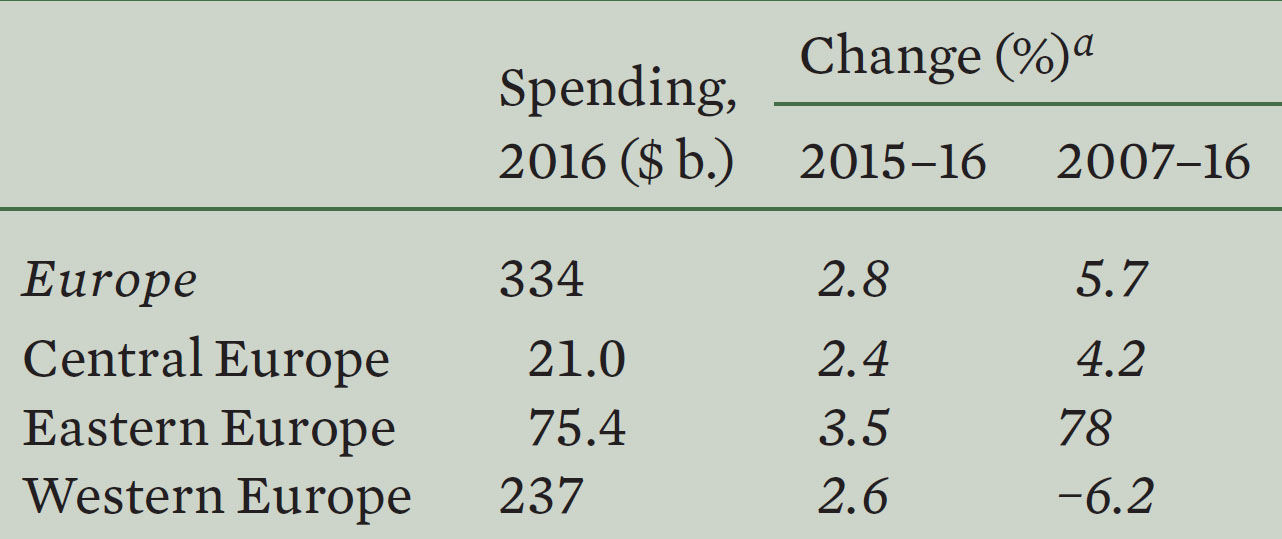
a Changes are in real terms.
Four of the fifteen largest military spenders in the world— France, the UK, Germany and Italy in ranked order—are in Western Europe. Together, they account for 10 per cent of global military expenditure. In 2016 neither France nor the UK achieved the planned increases in military spending announced in 2015. Germany raised its military spending by 2.9 per cent in 2016, a direct result of Chancellor Angela Merkel’s efforts to push through an increase in the military budget. Italy increased its military spending by 11 per cent. This can be partly attributed to its support for its local arms industry by funding domestic procurement.
Central European countries continued to collectively increase their military spending, which was up by 2.4 per cent in 2016 compared with 2015. This represents a return to the level of the subregion’s average 10-year growth rate after a 14 per cent increase between 2014 and 2015. The 2015 increase is explained by a one-off payment for arms procurements made 10 years ago by Poland, the subregion’s largest spender (44 per cent of Central European military spending).
Many of the European countries with the largest relative increases in military spending between 2015 and 2016 are in Central Europe. Given the wider regional slowdown, this ongoing rise suggests that the perception of an increased threat from Russia following the Ukraine crisis persists. At 44 per cent, Latvia’s increase in military expenditure in 2016 was the highest in Europe, while Lithuania’s military expenditure rose by 35 per cent (see table 6).
Table 6. The biggest increases and decreases in military spending, 2015–16
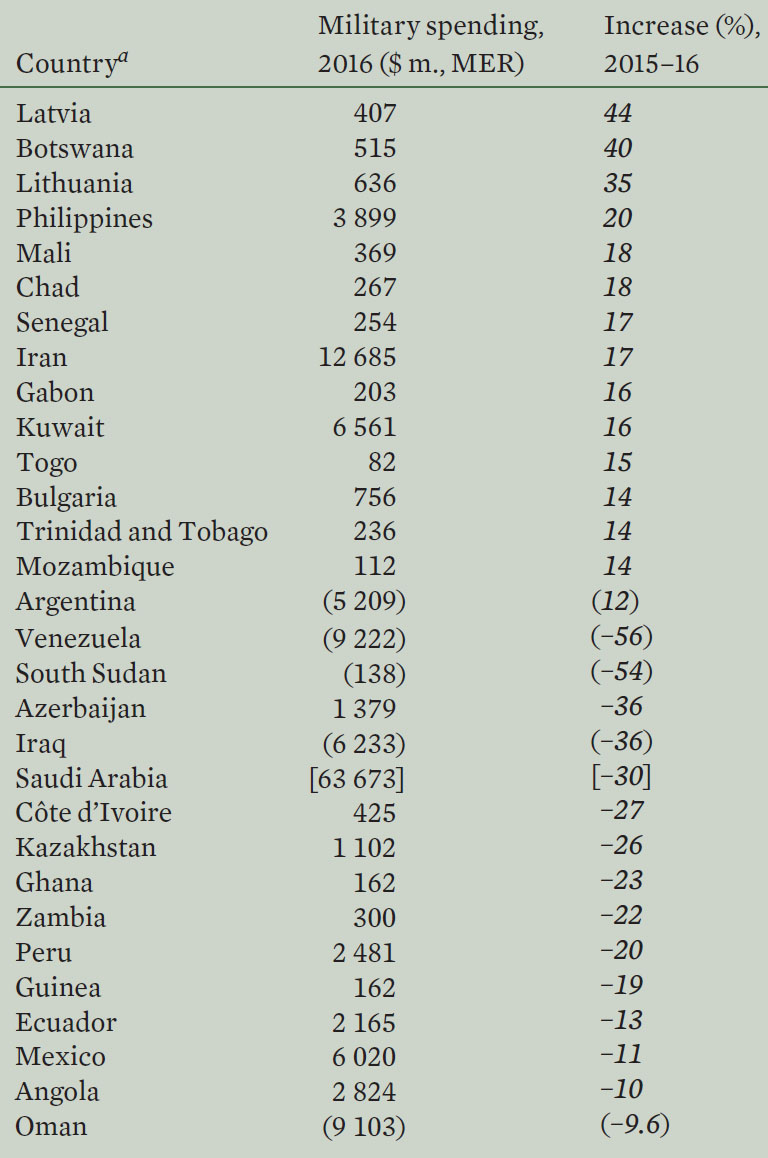
Spending figures are in US$ million, at current prices and exchange rates. Figures for changes are calculated from spending figures in constant (2015) prices. Countries are ordered by actual % increase or decrease.
[ ] = SIPRI estimate; ( ) = uncertain estimate; MER = market exchange rates.
a Countries with military expenditure in 2016 of less than $100 million, or $50 million in Africa, are excluded.
In Eastern Europe, Russia’s military spending in 2016 was $69.2 billion, an increase of 5.9 per cent over 2015 and 87 per cent compared with 2007. Spending in 2016 was 5.3 per cent of GDP—the highest proportion since Russia became an independent state and the seventh highest military burden globally. This increased spending and heavy burden on the economy comes at a time when the Russian economy is in serious trouble due to low oil and gas prices and the economic sanctions imposed since 2014. It was originally expected and planned that the Russian Government would reduce its spending, including military spending. However, late in 2016 actual spending was pushed substantially higher by a decision to make a one-off payment of roughly $11.8 billion in government debt to Russian arms producers. Without this debt repayment, Russia’s military spending would have decreased by 12 per cent.
Ukraine’s military expenditure in 2016 was $3.5 billion, a decrease of 3.8 per cent. Between 2007 and 2016, its military expenditure increased by 28 per cent. The small fall in 2016 was due to a reduction in the overall intensity of the conflict in the country. However, fighting flared up several times in 2016 and military spending is planned to increase in 2017, in part for acquisitions of new equipment.
Despite ongoing clashes between Armenia and Azerbaijan, military spending in both countries fell for the first time since 2011. Armenia’s spending decreased by 5.5 per cent. Azerbaijan’s military expenditure was heavily affected by low oil prices and fell by 36 per cent to $1.4 billion in 2016.
Middle East
SIPRI is not publishing an estimate of military spending for the Middle East for 2016 as data is unavailable for Lebanon, Qatar, Syria, the UAE (which was the second largest military spender in the region in 2014) and Yemen. For those countries for which data is available, their combined total military expenditure in 2016 showed a decrease of 17 per cent compared with 2015 but a 19 per cent increase compared with 2007. The decrease in 2016 came despite the fact that all countries except Oman were militarily involved in at least one armed confl ict in the region. This demonstrates the impact of the fall in oil prices on the economies of several of the region’s major military spenders.
The military burden is particularly high in the Middle East. Military spending as a share of GDP, for those countries in the region for which data is available, averaged 6.0 per cent in 2016—almost triple the global average of 2.2 per cent. Oman had the highest military burden in the world, at 17 per cent, followed by Saudi Arabia at 10 per cent.
Saudi Arabia’s estimated budget of $63.7 billion in 2016 makes it by far the largest military spender in the region and the fourth largest in the world. While Saudi Arabia had been increasing its military spending year-on-year since 2002, its spending in 2016 was a 30 per cent decrease on 2015. By contrast, Iran’s military expenditure decreased by 7.3 per cent between 2007 and 2016, but rose by 17 per cent between 2015 and 2016. The lifting of international sanctions has benefited the Iranian economy, improving incomes and giving the government the freedom to increase military spending.
Israel was the 15th largest military spender in the world in 2016. Its expenditure grew by 19 per cent between 2007 and 2016 to $18 billion. This figure excludes about $3.5 billion in military aid from the USA. Turkey increased its military spending by 9.7 per cent between 2007 and 2016. At $14.8 billion, it is the 18th largest military spender globally. However, the figure for actual spending in 2016 is uncertain. Since the attempted military coup in July 2016, detailed data on Turkish military expenditure has become more difficult to find.
Military Expenditure and The Price Of Oil
There are many drivers of military spending, most notably armed confl ict, perceptions of security, the price of oil and income. Oil price is an important factor because of its impact on the national budgets of oil-exporting countries. In general, patterns of military spending over the past 10 years can be associated economic problems attached to the oil-price shock have forced many oil-exporting countries to cut their total government budgets, which usually also includes cutting military spending. In some cases, the decreases have been so severe that it has aff ected regional and subregional trends (e.g. in Africa and South America).
Although the oil-price slump has had varying degrees of impact on the economies of oil-exporting countries, since 2015 military expenditure, in real US dollars, has decreased for the vast majority of oil-exporting countries. This reflects the severity of the shock and highlights the need for sectoral reform to foster the diversification of oil exporters’ economies. Of the 15 countries with the largest decreases since 2015, only two (Guinea and Zambia) were not oil exporters (see table 6).
Most countries with undiversified, oil-export dependent economies have seen their military spending fall since 2015. This includes countries such as Angola, Azerbaijan, Iraq, South Sudan and Venezuela. These countries suffer from poor fiscal buffers, and many are frequently actively involved in conflict. A minority of oil-exporting countries are better equipped economically to deal with such a shock (e.g. Kuwait and Norway) and were able to continue with their existing spending plans and marginally increased their spending in 2016.
No comments:
Post a Comment