Fabian Mendez Ramos
Whereas sustained economic growth is considered the primary driver of poverty alleviation, the different ways in which growth interacts with changes in income inequality mean that the future of poverty reduction is highly uncertain.
In a recently published working paper, I use historical (1980-2014) data to model and simulate future paths of income inequality and growth, which, in turn, enable us to quantify country-specific changes in poverty rates and income distribution. Our historical-based simulations estimate that the probability of alleviating extreme poverty below the 3 percent threshold by 2030 (Sustainable Development Goal 1) at the global level is small—less than 2 percent.
Furthermore, our results indicate significant variation in future poverty outcomes. For instance, by 2030, the most favorable estimate of poverty headcount at the global level displays a median value of 4.6 percent, with a standard deviation of 0.5. Conversely, our most pessimistic result shows a median outcome of 8.9 percent with a standard deviation of 0.9. These median estimates represent approximately 370 and 720 million people around the world subsisting on less than $1.90 a day (2011 PPP).
In terms of country groupings, in relative terms, extreme poverty is expected to decline in the period 2015-2030 in economies with low, middle, and high rates of per capita output growth. However, in low-output growth economies, the absolute number of poor is expected to increase. The model simulations also predict that high-output growth economies—countries with steady growth rates above 4 percent—will reach poverty rates below a 3 percent level before 2030. Noticeably, the simulations display a low degree of uncertainty around the expected poverty rates in these high-output growth countries.
Moreover, non-resource-output oriented—or more diversified—economies, are predicted to achieve and go below the 3 percent poverty target by 2030. By contrast, several simulation exercises show resource-based economies witnessing an increase in absolute poverty during the period 2015-2030. We find significant dispersion in the estimated paths of poverty outcomes in these resource-based countries, implying that given recent history, it is hardly possible to predict precise estimates of poverty rates in these economies.
Resource-based economies. What is the current and future poverty situation in countries that rely heavily on natural resources? Figure 1 depicts two conditions. First, most countries with abundant natural resource rents in the period 1970-2015 have high rates of extreme poverty. Second, the majority of countries with high poverty headcounts had median annual growth rates of GDP per capita during 1970-2014 below the 4 percent threshold. In sum, it is quite likely that resource-based countries will keep elevated poverty rates by 2030: The most optimistic and pessimistic simulations show median poverty rates of 9 and 20 percent, respectively.
What can resource-based countries do? The main goal in resource-based countries can be the same as for the majority of countries in the world with high poverty rates: to expand the economy more quickly. Because of the volatility of resource prices, the primary strategy could focus on providing more stable economic and financial conditions. This strategy can be reached by developing sustainable debt management frameworks, improving investment and business climates, as well as implementing more transparent and accountable rules to administer resource rents. Additionally, these economies can benefit from strengthening their institutions, including those involving risk management backgrounds. Potential reforms include fiscal rules (probably balanced budgetdesigns) for commodity revenues, commodity price hedging, diversification strategies of the economic activities, among other actions.
Figure 1. Most resource-based countries currently face—and will likely keep by 2030—elevated poverty rates
GDP per capita growth, natural resource rents, and extreme poverty
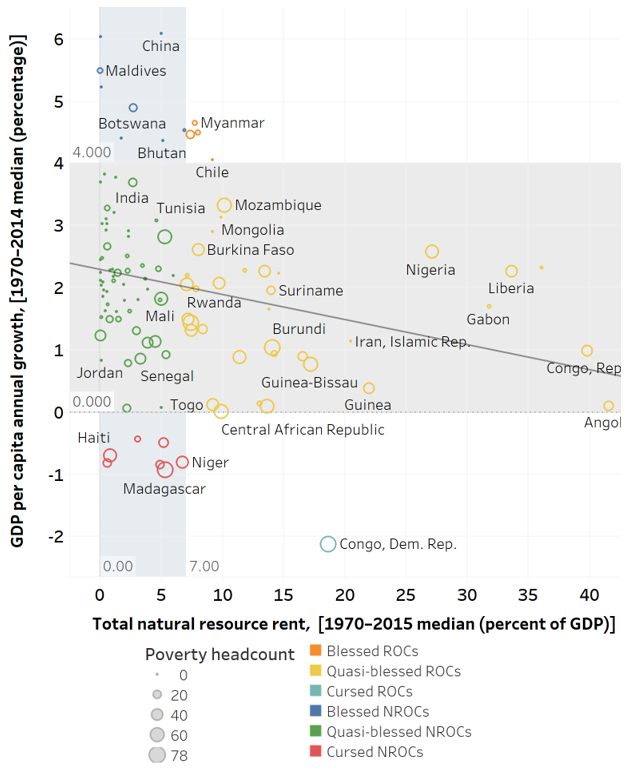
Source: Penn World Table 9.0, World Development Indicators, PovcalNet, United Nations, and the author’s estimates. Note: Last available observations of poverty rates reported in PovcalNet. The figure is based on the $1.90 a day (2011 PPP) poverty line. ROCs stands for resource-based countries. NROCs means non-resource-output oriented (non-resource-based) countries.
Income inequality. What do the simulations suggest about shifts in income inequality? Most changes in relative income inequality are predicted to be on the positive side. The Gini coefficient across the board is generally predicted to decrease on average over the period 2015-2030. Across this 2015-2030 horizon, our estimates of the Gini coefficient at the global level—population-weighted averages—are expected to decline between 0.7 and 1.9 Gini points (in the Gini scale of 0-100). However, some of our country-grouping estimates of the Gini coefficient display substantial uncertainty and downside risks that imply an increase in the level of inequality in the 2015-2030 period; these negative estimates are especially significant in more diversified countries, and in economies with historically high and low rates of output per capita growth.
A multiplicity of historical-based results exacerbate uncertainty. In comparison with point predictions and perfect-foresight methods, our approach considers both the outcome precision of a multitude of historical-based scenarios and the uncertainty—standard deviation of simulated outcomes—embedded in the predictive fan chart generated for each situation. This multiplicity of results and the predictive fan chart and associated uncertainty provide strong incentives for the improved design of policies for poverty reduction and income redistribution. It is crucial to continue thinking in the design of hedging mechanisms against risks under variable economic environments affecting poverty and income distribution.
No comments:
Post a Comment