


SUMITRA BADRINATHAN, DEVESH KAPUR, MILAN VAISHNAV
As the 2020 presidential election in the United States approaches, Indian Americans are unexpectedly in the spotlight thanks to their growing affluence and influence in political circles and Democratic candidate Joe Biden’s selection of Kamala Harris (who is of partial Indian origin) as his running mate.
But significant attention is also being paid to Indian Americans because a narrative is emerging that the apparent courtship between U.S. President Donald Trump and Indian Prime Minister Narendra Modi, compounded by concerns over how a Biden administration might manage U.S.-India ties, will push Indian Americans to abandon the Democratic Party in droves.
Sumitra Badrinathan is an advanced PhD student in political science at the University of Pennsylvania. She studies misinformation, media effects, and political behavior, and employs survey and experimental methods in her work.
This study finds no empirical evidence to support either of these claims. The analysis is based on a nationally representative online survey of 936 Indian American citizens—the Indian American Attitudes Survey (IAAS)—conducted between September 1 and September 20, 2020, in partnership with the research and analytics firm YouGov. The survey has an overall margin of error of +/- 3.2 percent.
The data show that Indian Americans continue to be strongly attached to the Democratic Party, with little indication of a shift toward the Republican Party. In addition, Indian Americans view U.S.-India relations as a low priority issue in this electoral cycle, emphasizing instead nationally salient issues such as healthcare and the economy. As the political behavior of Indian Americans in the United States gains influence, this study provides an empirically robust and analytically nuanced picture of the diversity in attitudes of this important demographic.
Between 2000 and 2018, the Indian American population grew by nearly 150 percent, making it the second-largest immigrant group in America today. The community’s elevated levels of educational attainment and household income render its members valuable campaign contributors and potential mobilizers. And in select swing states, the Indian American population is larger than the margin of victory that separated Hillary Clinton and Trump in the closely contested 2016 presidential race.
Devesh Kapur is Starr Foundation Professor of South Asian Studies and director of Asia Programs at the Johns Hopkins School of Advanced International Studies (SAIS).
Yet, despite the rising political profile of Indian Americans, their political attitudes are woefully under-studied. The objective of this study is to harness new empirical data that can help characterize the political attitudes and preferences of Indian Americans. The findings in this study, the first in a series on the political attitudes of Indian Americans, are briefly summarized below:
Indian Americans remain solidly with the Democratic Party. Recent anecdotal narratives notwithstanding, there is scant evidence that Democratic voters are defecting toward Trump and the Republican Party. Seventy-two percent of registered Indian American voters plan to vote for Biden and 22 percent intend to vote for Trump in the 2020 November election.
Indian Americans do not consider U.S.-India relations to be one of the principal determinants of their vote choice in this election. The economy and healthcare are the two most important issues influencing the vote choice of Indian Americans, although supporters of the two parties differ on key priorities. “Kitchen table” issues dominate over foreign policy concerns.
Indian Americans exhibit signs of significant political polarization. Just like the wider voting public, Republican and Democratic Indian American voters are politically polarized and hold markedly negative views of the opposing party and divergent positions on several contentious policy issues—from immigration to law enforcement.
U.S.-born Indian American citizens tilt left compared to foreign-born citizens. While both U.S.-born and naturalized Indian Americans favor the Democratic Party, this tilt is more pronounced for U.S.-born Indian Americans. Political participation by naturalized citizens is more muted, however, manifesting in lower rates of voter turnout and weaker partisan identification.
Harris has mobilized Indian Americans, especially Democrats. Harris’s vice presidential candidacy has galvanized a large section of the Indian American community to turn out to vote. On balance, while the Harris pick might not change large numbers of votes (given the community’s historic Democratic orientation), her candidacy is linked to greater enthusiasm for the Democratic ticket.
A large section of Indian Americans view the Republican Party as unwelcoming. Indian Americans refrain from identifying with the Republican Party due, in part, to a perception that the party is intolerant of minorities and overly influenced by Christian evangelicalism. Those who identify as Republicans are primarily moved to do so because of economic policy differences with the Democrats—with particularly marked differences regarding healthcare.
Political beliefs seep into perceptions of U.S.-India bilateral relations. Indian Americans believe Democrats do a better job of managing U.S.-India ties by a considerable margin while Republicans hold more favorable views of Modi.
INTRODUCTION
The November 2020 presidential election in the United States is unprecedented in multiple ways.
The election is being fought in the middle of a global health pandemic that is upending precedents about campaigns and campaigning. The U.S. economy, like so many economies around the world, is experiencing devastation not seen since the Great Depression. Political polarization, long a marker of partisan politics, appears to be deepening further. Views on a diverse array of subjects—from the health of the economy to the coronavirus pandemic and the state of law and order—appear deeply influenced by voters’ partisan affiliations.
Another unexpected feature of this election is that both the Democratic and Republican parties are enthusiastically courting Indian American voters to an extent never seen before.
Even though Indian Americans comprise slightly more than 1 percent of the total U.S. population—and less than 1 percent of all registered voters—both major parties are leaving no stone unturned in reaching out to this community (perhaps mindful of the closeness of the 2016 elections).1 For instance, Biden’s campaign issued a manifesto specifically aimed at Indian American voters.2 Trump’s campaign, on the other hand, recently shared an online advertisement wooing Indians in America with images of Trump and Indian Prime Minister Narendra Modi sharing the stage at a massive rally in Houston in September 2019.3
For several consecutive election cycles, the Indian community in the United States has been a strong supporter of the Democratic Party.4 Numerous surveys, including the 2004 Survey of Asian Indians in the United States, the Pew Research Center’s 2012 Asian-American Survey, and successive waves of the National Asian American Survey (NAAS) conducted in 2008, 2012, and 2016 all indicate that a sizable majority of Indian Americans is partial to the Democratic Party.5 Indeed, the survey data demonstrate that the reliably pro-Democratic leanings of the Indian American community are more pronounced than for the Asian American population as a whole.6
Vaishnav’s primary research focus is the political economy of India, and he examines issues such as corruption and governance, state capacity, distributive politics, and electoral behavior.
However, there is an emerging narrative that suggests 2020 might well see a significant shift of Indian American voters to the Republican Party due to two factors: Trump’s perceived closeness to Modi, and/or criticisms (perceived or real) of the Modi government by prominent members of the Democratic Party, not least Biden’s running mate, Harris (who herself shares an Indian American identity).7 Indeed, some recent survey data suggest that Indian American support for the Democratic Party in 2020 appears to have slipped somewhat from its 2016 level.
Yet, despite the rising political profile of Indian Americans, their political attitudes are woefully under-studied. The objective of this study is to harness new empirical data that can help characterize the political attitudes and preferences of Indian Americans. It is based on a nationally representative online survey of 936 Indian American citizens—the 2020 Indian American Attitudes Survey (IAAS)—conducted between September 1 and September 20, 2020, in partnership with YouGov. The survey was conducted online using YouGov’s proprietary panel of 1.8 million Americans and has an overall margin of error of +/- 3.2 percent.
Specifically, this study addresses seven questions regarding Indian American voter behavior:
How are Indian Americans likely to vote in the 2020 presidential election?
Do Indian Americans exhibit signs of partisan polarization akin to what is observed in the U.S. population at large?
What policy issues are animating the Indian American community this election year?
Are there discernible differences between the political attitudes of naturalized Indian Americans (that is, those who immigrated to the United States) and those who were born in the United States?
Will the nomination of Harris as Biden’s vice presidential candidate impact either voter turnout among Indian Americans or how members of the community cast their ballots?
What factors explain the partisan preferences of the Indian American community?
How much do U.S.-India relations shape the political preferences of Indian Americans? And to what extent does politics in India inform their voting decisions in U.S. elections?
This is the first in a series of empirical examinations of Indians residing in the United States, drawing on IAAS data. Future studies will examine the attitudes of Indian Americans toward India and the community’s social and political acculturation in America.
INDIAN AMERICANS: A BRIEF SNAPSHOT
Indian Americans are one of the most rapidly growing immigrant groups in the United States, roughly doubling in size in each of the last four decades.8 In 2018, the size of the Indian American population stood at 4.16 million, out of which 2.62 million were U.S. citizens.9
Of the citizen population, 1.4 million were naturalized citizens while 1.2 million were born in the United States.10 Of that group, the total eligible voter population is 1.9 million, or about 0.82 percent of all eligible voters in the country.11
The Indian American voting population is heavily foreign-born and growing rapidly. As of 2018, about 14 percent of the U.S. population was foreign-born. However, among Asian Indians (the appellation given Indian Americans by the U.S. Census), nearly 71 percent were foreign-born (see table 1). In 2018, out of all newly minted U.S. citizens (that is, those naturalized that year), 17 percent were born in Mexico, 7 percent in India, and 5 percent each in China and the Philippines.
This rapid population growth means that the Indian American voting population is reaching a degree of newfound electoral significance. Indeed, the Indian American eligible voter population has grown to be larger than several of the victory margins seen in the 2016 presidential election, particularly in battleground states such as Michigan, New Hampshire, and Pennsylvania.12

Two-thirds of Indian Americans entered the country after 2000.13 In particular, Indians have been huge beneficiaries of America’s skills-based visa regime: India accounts for one out of every two H-1B (high-skilled worker) visas issued between 2001 and 2015.14 This means that their socialization—whether citizens or not—into American politics has also been of limited duration. However, one factor that might aid their integration into America is the fact that more than half of them (54 percent) speak English “very well.”15 With 40 percent of the Indian American population entering the United States after 2010, it is likely that the political landscape has not yet fully adjusted to this rapidly growing community.
The social and political realities characterizing the Indian American community are shaped by a set of distinctive demographic features.16 Seventy-six percent of Indian Americans hold a bachelor’s degree or higher, compared to 33 percent nationwide. The median income for Indian American households is $120,000 (compared to $62,000 for the United States as a whole), while the share living in poverty—6.5 percent—is half that of the U.S. population overall (13 percent).17 It is likely that these characteristics of the Indian American community have amplified the community’s political significance as it has come to represent a collection of potential high-net-worth campaign donors. During the 2020 primary season, Indian Americans contributed $3 million to presidential campaigns, exceeding Hollywood’s prodigious political activities, according to one report.18
SURVEY OVERVIEW
The data for this study are based on an original online survey—the Indian American Attitudes Survey—of 936 Indian American U.S. citizens conducted by polling firm YouGov between September 1 and September 20, 2020. The overall IAAS sample contains 1,200 respondents (both U.S. citizens and non-citizens), but this study focuses on the subset of U.S. citizens in the sample because its primary objective is to shed light on political activities relevant to the 2020 presidential election.
YouGov recruited respondents from its proprietary panel comprised of 1.8 million U.S. residents. For the IAAS, only adult respondents (ages eighteen and above) who identify as Indian American or a person of (Asian) Indian origin were able to participate in the survey. YouGov employs a sophisticated sample matching procedure to ensure that the respondent pool is representative of the Indian American community in the United States, using data from the U.S. Census Bureau’s 2018 American Community Survey (ACS) as a target sample frame. All the analyses in this study employ sampling weights to ensure representativeness.19
The overall margin of error for the U.S. citizen sub-sample in the IAAS analyzed here is +/- 3.2 percent.20 This margin of error is calculated at the 95 percent confidence interval. Further methodological details can be found in Appendix A, along with a state-wise map of survey respondents.
The survey instrument contains 157 questions organized across six modules: basic demographics; immigration, citizenship, and family background; presidential campaigns and voting; U.S. politics and foreign policy; culture and social behavior; and Indian politics. Respondents were allowed to skip questions save for important demographic questions that determined the nature of other survey items.
Table 2 provides a demographic profile of the IAAS sample in comparison to the Indian American population as a whole. The latter relies on data from the 2018 ACS on the Asian Indian population in the United States.

KEY FINDINGS
INDIAN AMERICAN POLITICAL PREFERENCES
This section explores five aspects of Indian Americans’ political preferences. It begins with three standard metrics: party identification, political ideology, and presidential vote choice. It then turns its attention to evaluations of Trump’s leadership and the issue of affective polarization.
Party identification
In line with past studies of Indian American voting behavior, the IAAS finds that members of the community continue to strongly identify with the Democratic Party. The survey asks U.S. citizens about party identification in two ways, and both demonstrate similar results (see figure 1).
When asked how they self-identify, 56 percent of Indian Americans report that they consider themselves Democrats, 15 percent consider themselves to be Republicans, while another 22 percent identify as independents.

The numbers reported in the survey are similar to those found in the recently released 2020 preelection Asian American Voter Survey (AAVS): 54 percent of Asian Indians identify as Democrats, 16 percent as Republicans, and 28 percent as independents.21 When survey respondents were asked to report their actual party registration (as opposed to the party they personally identify with), the results were very similar. Fifty-seven percent are registered Democrats, while just 13 percent are registered Republicans.
After asking about party identification, the survey asked whether respondents identify strongly or not strongly with their chosen party (and asked independents whether they lean toward either major party).
Thirty-seven percent of respondents identify as strong Democrats, 19 percent identify as not very strong Democrats, and another 10 percent lean toward the Democratic Party. On the other side, just 7 percent of respondents identify as strong Republicans while another 8 percent are not very strong Republicans and only 3 percent lean Republican. All told, two-thirds of respondents (66 percent) tend toward the Democratic Party while 18 percent tend toward the Republican Party. Thirteen percent of respondents are independents who do not lean toward either party, while 4 percent are not sure of where they stand.22
Political ideology
In terms of political ideology, the survey shows that Indian Americans clearly skew left (see figure 2). Respondents were asked to place themselves on a standard, 7-point ideological scale derived from the American National Election Studies (ANES)—ranging from extremely liberal to extremely conservative. Because there is a natural tendency for survey participants to select the centrist position (identifying themselves as “moderate”), respondents who selected this option (or who say they have not thought much about this issue) were asked whether, if forced to choose, they would consider themselves to be liberal or conservative. For the purposes of this study, responses from these two questions were combined to array respondents on a single ideological spectrum.

While 29 percent of Indian American citizens classify themselves as moderate, a larger share of the remaining respondents place themselves on the ideological left: 11 percent identify as extremely liberal, 23 percent identify as liberal, and 13 percent identify as slightly liberal. The proportion of respondents situated on the right end of the ideological spectrum is much smaller: 4 percent identify as extremely conservative, 13 percent identify as conservative, and an additional 6 percent identify as slightly conservative.
Presidential vote choice
Of course, the issue of greatest interest to election watchers is how Indian Americans ultimately intend to vote in the presidential election on November 3.
Restricting the analysis first to registered voters (N=842), 72 percent of registered Indian American voters plan to vote for Biden, 22 percent intend to vote for Trump, 3 percent will support a third-party candidate, and 3 percent do not intend to vote at all (see figure 3).

For comparison’s sake, the 2020 preelection AAVS survey of registered voters found that 65 percent of Asian Indians are inclined to vote for Biden, 28 percent for Trump, 6 percent are undecided, and just 1 percent intend to back another candidate.23
The partisan gap is somewhat smaller when examining all U.S. citizens, whether or not they are registered to vote (see figure 4). Sixty-eight percent of Indian American citizens plan to vote for Biden compared to 22 percent for Trump. Three percent plan to vote for a third-party candidate, while 7 percent do not intend to vote at all in the election.

The big takeaway from these numbers is that there is scant evidence in the survey for the widespread defection of Democratic voters toward Trump—contrary to popular narratives that have surfaced in the media.24
Of citizens who identify as Democrats, 89 percent plan to vote for Biden, while a slightly smaller share (80 percent) of Republicans plan to back Trump in November. Of greater interest to political observers is how independents will likely break. The survey suggests that 64 percent of respondents who identify as independents (about one-eighth of all Indian American voters) will back Biden, while 22 percent intend to vote for Trump, similar to the broader community’s overall political preferences.
Furthermore, there is little evidence of a significant evolution in partisan allegiances since 2016. The vast majority (91 percent) of Indian Americans who voted for Democratic candidate Hillary Clinton in 2016 plan to support Biden in 2020. A smaller percentage of Indian Americans who voted for Trump in 2016 (68 percent) plan to support him again in 2020. While this suggests a higher rate of disaffection with Trump, it is difficult to draw strong inferences given the small overall sample size of Trump voters.
Four demographic patterns in Indian Americans’ presidential vote choice stand out (See table 3).
First, there is no linear relationship between age and vote choice. Seventy-five percent of voters between the ages of eighteen and twenty-nine intend to vote for Biden; this proportion declines to 64 percent for ages thirty to forty-nine before rising again to 69 percent for those above the age of fifty. Age-wise, support for Trump essentially presents the mirror image.
Second, Indians of all religious faiths prefer Biden to Trump, but with important caveats.25 Muslim support for Biden (82 percent) is considerably higher than Hindu support (67 percent), which in turn is considerably higher than Christian support (49 percent). The latter community is also the most supportive of Trump (45 percent).
Third, support for Biden is greater among U.S.-born citizens (71 percent) than naturalized citizens (66 percent), although the two demonstrate equivalent support for Trump (22 percent). A key difference here is that more naturalized citizens report that they do not intend to vote in the November election. Interestingly, the year of respondents’ arrival in the United States has little impact on vote choice, and the duration of stay in the United States shows no clear pattern: while those naturalized citizens who have lived in the United States between eleven and twenty-five years are the most likely to support Biden (70 percent), support for Trump is greater among those who have lived in the United States for less than a decade (28 percent).
Fourth, Indian American political attitudes do not exhibit a strong gender gap, in contrast to the U.S. population as a whole. According to the September 13–15 Economist/YouGov weekly tracker poll of 1,500 U.S. adults (a survey fielded the same time as our own), among registered voters, male support for Trump and Biden was deadlocked at 45 percent each.26 However, women favored Biden over Trump by a wide margin: 54 to 38 percent. In contrast, Indian American men and women both prefer Biden to Trump by considerable margins. Sixty-nine percent of women and 68 percent of men intend to vote for Biden this November, while just 19 percent of women and 24 percent of men plan to vote for Trump.

Overall, when comparing the IAAS top-line findings with those of the Economist/YouGov survey, Indian Americans appear to be situated somewhere between Black and Hispanic Americans in terms of the intensity of support for Biden’s candidacy and corresponding lack of enthusiasm for Trump’s (see table 4). Among registered voters, 79 percent of Black Americans and 64 percent of Hispanic Americans intend to vote for Biden, compared to 72 percent of Indian Americans. Thus, Indian Americans’ preferences are broadly in line with the voting preferences of other minorities, although they are more markedly pro-Democratic than the preferences of other Asian American voters.

Evaluation of political leadership
The survey asked respondents whether they think things in the United States are generally going in the right direction or have gone off on the wrong track. A two-thirds majority (68 percent) believes that things in America are headed in the wrong direction. Unsurprisingly, this sentiment is echoed in their overall evaluation of how Trump is handling his job as chief executive (see figure 5). Fifty-five percent of respondents strongly disapprove of Trump’s performance, while another 15 percent disapprove. Just 16 percent and 13 percent strongly approve or approve of Trump’s handling of the presidency, respectively.

Understandably, partisan identity mediates respondents’ evaluations of Trump’s performance to date. However, Trump does not fare particularly well—even among Indian American Republicans (see figure 6). Fewer than half of Republicans (44 percent) strongly approve of Trump (compared to 12 percent of Democrats), while 27 percent of Republicans approve of him (versus 8 percent of Democrats). When it comes to expressing disapproval, 65 percent of Democrats strongly disapprove and 15 percent disapprove of the job he is doing. Thirteen percent of Republicans strongly disapprove, while another 16 percent disapprove.

Affective polarization
One of the hallmarks of American political life in recent decades is the worrying degree of affective polarization in society. Affective polarization is the degree of animosity that exists between individuals possessing different partisan identities or affiliations.27
One of the classic methods of measuring affective polarization is to rely on individuals’ self-reported feelings as recorded through surveys such as the IAAS. For many years, the ANES has included a “feeling thermometer” question whereby respondents are asked to rate political parties or individual leaders on a scale of 0 to 100. Ratings between 0 and 49 mean that respondents do not feel favorable toward the person or do not care for the person or entity, a rating of 50 means that respondents are indifferent toward them, and ratings between 51 and 100 degrees mean that respondents feel favorable and warm toward them.
The results of the feeling thermometer question contained in the IAAS are revealing and exhibit significant polarization among Indian Americans with differing partisan affiliations (see figure 7).28 With respect to the Democratic Party, the mean feeling thermometer rating given by Democrats stands at 75 but is just 39 for Republicans. The opposite is true for the Republican Party: the mean rating provided by Republicans of their own party is 73 but just 33 for Democrats.

Turning to individual political leaders, Biden’s rating is 75 among Democrats but 39 among Republicans. Biden’s standing is identical to that of the Democratic Party as a whole, for both Democratic and Republican Indian American respondents. Trump modestly underperforms his party’s brand among Republicans (mean rating of 69) and is very low among Democrats (27). Democratic vice presidential candidate Harris rates well among Democrats (72) and slightly better among Republicans (41) than either the Democratic Party or Biden.
ANIMATING POLICY ISSUES
The survey asked respondents to rank their top three most important issues that will influence their vote choice in the November presidential election (see figure 8). Focusing on the issues that respondents ranked as number one, the economy (21 percent) is the most common response, followed closely on its heels by healthcare (20 percent). In the wake of an economic crisis and a pandemic, it is perhaps unsurprising that these two issues are at the top of voters’ minds. Racism/racial discrimination (12 percent), taxes (9 percent), and government corruption (8 percent) round out the top five issues.

Interestingly, given all the talk about how America’s ties with India might shape Indian American voting behavior this election, U.S.-India relations rank next to last: just 3 percent of respondents rank it as their most important election issue. In fact, as demonstrated further below, U.S.-India relations are not even respondents’ most common second- or third-ranked issues. This is not very surprising since the top foreign policy priority of American voters overall appears to emphasize reorienting U.S. foreign policy to more explicitly serve the everyday concerns of Americans and for the United States to be “strong at home.”29
These aggregate figures, however, once again mask a significant amount of partisan variation. On several issues, Democrats and Republicans have very different priorities (see figure 9). For instance, 36 percent of Republicans rate the economy as their number one priority this election, compared to just 16 of Democrats. The latter, in turn, record healthcare as their number one issue (21 percent) compared to 12 percent for Republicans. Democrats are relatively more exercised about racism, income inequality, and the environment. Republicans, on the other hand, place a greater emphasis on taxes.

Indian Americans tend to hold policy positions that are significantly more in line with the progressive positions espoused by Democrats. For example, the survey asked respondents whether they support or oppose a set of five, hot-button policy issues of contemporary salience:
White House efforts to revoke the press credentials of reporters critical of the Trump administration
The 2017 presidential executive order to institute a travel ban for citizens from several predominantly Muslims countries
The decision by police and law enforcement in some cities to use rubber bullets, tear gas, and physical force against peaceful Black Lives Matter (BLM) protesters who are occupying public spaces (such as roads or highways)
Enhanced efforts by Immigration and Customs Enforcement (ICE) officials to identify and deport illegal immigrants through border apprehensions and unannounced raids30
The consideration of the racial identity of applicants as a factor in U.S. university admissions to improve the representation of African Americans
The survey shows that Indian Americans gravitate toward the liberal position on all five issues (see figure 10). Indian Americans feel most strongly about eroding press freedoms: 71 percent of respondents either strongly or somewhat oppose White House measures to retaliate against critical journalists. Two-thirds (67 percent) of Indian Americans oppose efforts by law enforcement to use force against peaceful BLM protesters who are occupying public spaces. A strong majority of Indian Americans oppose Trump’s so-called “Muslim ban” (60 percent) and stringent action by ICE to deport illegal immigrants (57 percent). Perhaps the one issue the community is most divided on is the matter of affirmative action in university admissions: a bare majority (54) supports this measure.

However, reflecting the polarization in American politics, Democrats and Republicans in the Indian American community rarely see eye-to-eye on these issues (see figure 11). The differences between the Democratic and Republican positions on most issues are stark. Seventy-four percent of Democrats oppose White House efforts to clamp down on the media, while 46 percent of Republicans feel the same way (28-point difference). On Trump’s “Muslim ban,” 67 percent of Democrats stand opposed compared to only 28 percent of their Republican counterparts (39-point difference). When it comes to using police force against BLM protesters occupying public spaces, 72 percent of Democrats oppose such action compared to 40 percent of Republicans (32-point difference). On enhanced ICE efforts to deport illegal immigrants, 64 percent of Democrats oppose those actions compared to 24 percent of Republicans (40-point difference).

The only issue where the views of Democrats and Republicans seem to approach convergence is affirmative action in university admissions. Sixty percent of Democrats and 50 percent of Republicans support affirmative action in higher education.31
POLITICAL ATTITUDES OF U.S.-BORN VERSUS NATURALIZED CITIZENS
This section examines whether there are discernible differences in the political attitudes of naturalized Indian American citizens compared to U.S.-born citizens. Of the 936 respondents who are U.S. citizens, 51 percent were born in the United States, while 49 were born in another country.32 Around three-quarters of foreign-born Indian Americans report India as their country of birth.
Figure 12 disaggregates partisan self-identification by whether respondents are U.S.-born or naturalized citizens.33 The Democratic-tilt that marks the community as a whole is visible for both groups, though it is more pronounced for U.S.-born Indian Americans.

The survey shows that U.S.-born Indian Americans are more likely to identify as Democrats than naturalized citizens. Sixty-four percent of U.S.-born Indian Americans identify as Democrats compared to 48 percent of immigrant Indians who have become naturalized citizens. The latter are more likely to identify as independents (25 percent to 19 percent) and as Republicans (17 percent to 12 percent). Naturalized citizens are also more likely to report being unsure about which political party they associate with: 9 percent to 3 percent.
With respect to political ideology, figure 13 demonstrates that U.S.-born Indian American citizens are more likely to identify as liberal (55 percent) than naturalized Indian American citizens (41 percent). However, U.S.-born citizens are marginally more likely to identify as conservative (26 percent to 22 percent). The key difference lies in the category of moderates; 37 percent of naturalized Indian American citizens fit this category compared to only 20 percent of U.S.-born citizens.

Despite these differences, however, the two categories of U.S. citizens do not significantly differ when it comes to presidential vote choice (see figure 14). Seventy-one percent of U.S.-born Indian Americans intend to vote for Biden compared to 66 percent of naturalized citizens. The propensity to vote for Trump is identical across the two groups: 22 percent for both U.S.-born and foreign-born. A key difference, however, is that 10 percent of naturalized Indian Americans do not intend to vote at all in November, compared to only 4 percent of U.S.-born Indian Americans.

One difficulty in comparing U.S.-born Indian Americans with naturalized citizens is that the former tend to be younger than the latter, on average. To account for the confounding variable of age—younger people tend to espouse more liberal views—one can restrict attention to only respondents who are forty or younger.
Even then, however, the differences described above only change at the margins (see table 5).
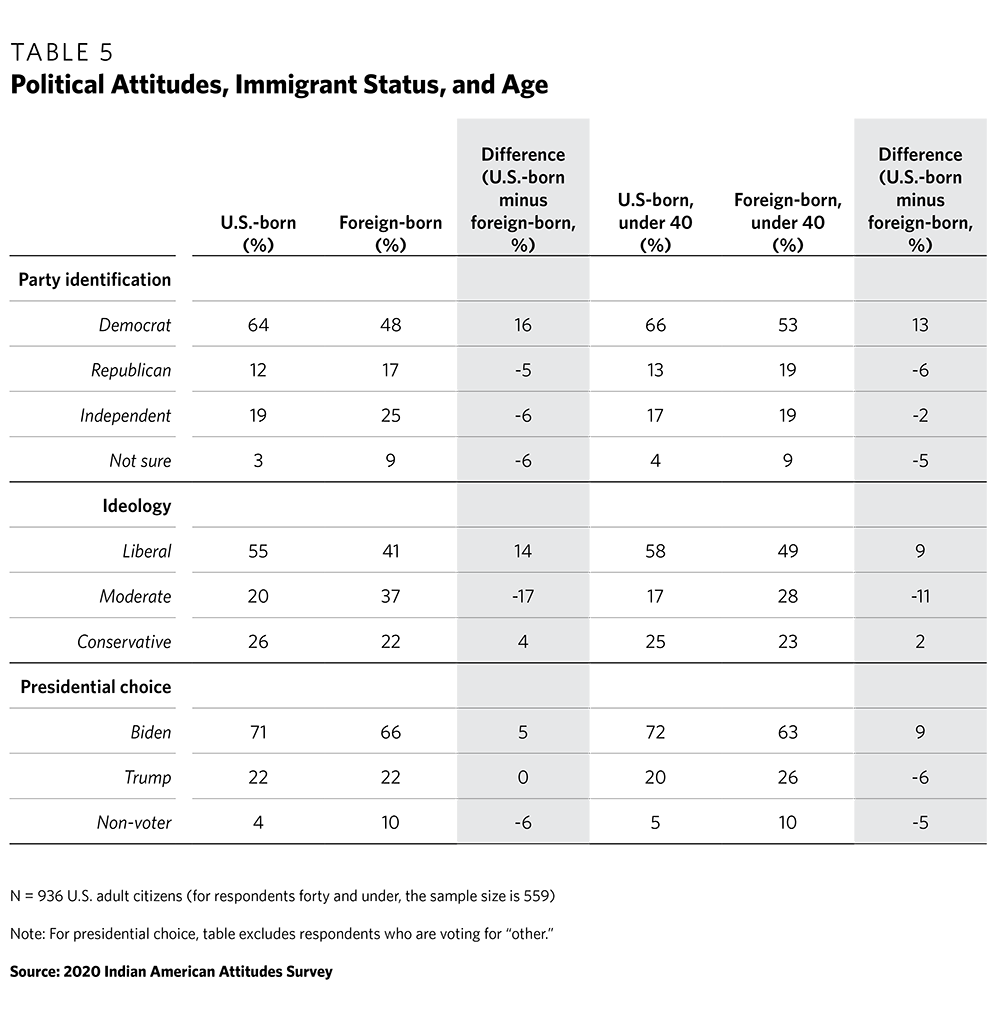
First, the pattern of partisan self-identification mirrors that of the overall Indian American population, although the share of independents is smaller.
Second, both U.S.-born and naturalized citizens under forty are more likely to identify as liberal compared to the overall citizen population. The share of moderates shrinks, while that of conservatives is relatively unchanged.
Third, when it comes to presidential vote choice, foreign-born citizens under forty are slightly less likely to support Biden and marginally more likely to vote for Trump in November. Yet these differences are not statistically meaningful. The share of those not planning to vote remains twice as high for foreign-born citizens under forty.
THE KAMALA HARRIS EFFECT
Biden’s selection of Harris as his vice presidential nominee triggered widespread speculation as to whether Harris’s addition to the ticket would be a net positive, net negative, or simply have no impact on the voting behavior of Indian Americans. This question became especially salient in discussions about the Indian American community given the spate of stories on Harris’s Indian mother and the impact of her Indian heritage (which was often juxtaposed to Harris’s self-identification as a Black woman).34 Some news reports suggested that the Indian American community enthusiastically embraced her selection,35 while others hinted at rifts within the community due to Harris’s previous positions on Indian domestic policy as well as her downplaying of her Indian identity relative to her Black identity.36
The survey approached this issue through two lenses. First, the survey asked respondents whether Biden’s selection of Harris made them more or less likely to vote in the November election (the turnout effect).37 Second, the survey asked whether Harris’s selection made them more or less enthusiastic about Biden’s candidacy (the enthusiasm effect).
With regards to turnout, 45 percent of respondents indicated that Harris’s selection made them more likely to vote in November while just 10 percent indicated that it made them less likely to vote (see figure 15). Another 40 percent said it made no difference either way. In all, the Harris pick does seem to have galvanized a large section of the Indian American community with respect to turning out to vote.

However, voters could be mobilized to vote either for Biden-Harris or against them. The survey data indicate that the mobilization effect is largely working in favor of the Democratic ticket (see figure 16): 49 percent of respondents indicated that Harris’s nomination made them more enthusiastic about Biden’s candidacy while just 15 percent reported that it made them less enthusiastic. To be sure, diminished enthusiasm cannot simply be equated with support for Trump, although it raises this possibility. Another 31 percent said it made no difference to them either way.

The survey further unpacks the enthusiasm effect, both positive and negative. For those who responded that the Harris selection made them more enthusiastic about Biden’s candidacy, the survey asked why (see figure 17). The modal response is that Harris is Indian American (26 percent), followed by the belief that she would be a centrist/moderate voice in a putative Biden administration (19 percent) and the fact that she is a woman (16 percent). Interestingly, and somewhat contrary to the media narrative, 15 percent of respondents report that Harris made them more enthusiastic about Biden’s candidacy because they believe she will strengthen U.S.-India ties.38

Finally, the survey also investigates the reasons why Harris’s addition to the Democratic ticket makes respondents less enthusiastic about Biden (see figure 18). The most popular reason given is that respondents had already made up their mind about their vote choice (22 percent), followed by the fact that Harris identifies more with her Black roots than her Indian roots (20 percent). Nineteen percent of respondents reported that they believe that Harris will weaken U.S.-India ties.

EXPLAINING INDIAN AMERICANS’ PARTISAN PREFERENCES
One puzzle about Indian American political behavior that prior research has not fully addressed is why exactly the community tilts so heavily toward the Democratic Party.39
To unpack some of the plausible reasons for this partisan preference, the survey asked respondents who identify either as Democrats or independents why they do not identify as Republicans. It also asked Republicans and independents about why they do not identify with the Democratic Party. While there may be several reasons a person does not identify with one or the other party, respondents were asked to rank their top two reasons from a list of choices provided in the survey (see figure 19). The response options were derived from hypotheses found in existing research on Indian Americans.

Interestingly, the most common reason Indian Americans do not identify with the Republican Party is the belief that it is intolerant of minorities, a response given by 27 percent of non-Republican respondents. The second most common reason (19 percent) selected is that the Republican Party is too influenced by Christian evangelicalism. An equal share (16 percent) disagrees with the Republicans on their stances on gun control and legal immigration. Fifteen percent reported that they do not think of themselves as Republicans because the party does not support their preferred economic policies. Just 6 percent selected the fact that the Republican Party is not good for India as their top reason.
For those respondents who disagree with the Republican Party on economic policy, the survey asked them on which economic policies—broadly construed—their preferences diverge the most from the Republicans (see figure 20). The most common response, by a two-to-one margin, was healthcare (38 percent). The next two most common responses were tax policy (19 percent) and climate change (18 percent).

Conversely, when respondents were asked why they do not identify with the Democratic Party, economic policy figures at the top of the list. Twenty-one percent of respondents who do not identify as Democrats say this is because the party does not support their preferred economic policies (see figure 21). Three other reasons follow in close succession: the Democratic Party is too focused on identity politics (20 percent), too influenced by the extreme left wing (19 percent), and is weak on illegal immigration (17 percent). However, just as with non-Republican identifiers, only a small share (9 percent) agree with the idea that Democrats would be bad for India as their topmost reason.

As above, for respondents whose economic views are not in sync with the Democratic Party, the survey asked them on which economic policy issue their preferences diverge the most from the Democrats (see figure 22). The modal response—mirroring the prior discussion about non-Republican identifiers—is healthcare (31 percent). In this case, tax policy finishes a relatively close second (26 percent), followed by business regulation (16 percent).

THE ROLE OF U.S.-INDIA RELATIONS
The survey responses make clear that U.S.-India ties do not figure prominently among the issues that animate Indian American voters on Election Day. This section examines this theme in greater detail.
Approval of Trump’s handling of U.S.-India relations
The survey asked whether respondents approve or disapprove of the way Trump is handling relations with India (see figure 23). The view is decidedly mixed. Twenty-two percent of respondents strongly approve of Trump’s handling of bilateral relations and another 11 approve (a combined approval of 33 percent). On the other hand, 25 percent of respondents strongly disapprove, while 12 disapprove (a combined disapproval of 37 percent). A large percentage—29 percent—do not express an opinion either way.

Partisan stewardship of bilateral ties
A significant segment of the media coverage preceding the election has insinuated that many Indian Americans are increasingly troubled with the Democratic Party’s foreign policy positions on India.40 This disquiet, it is suggested, is linked to opposition voiced by key Democratic lawmakers on Capitol Hill and several erstwhile presidential candidates (including Harris) with regards to changes in India’s polity under Modi.41
The survey asked respondents which party they believe does a better job of managing U.S.-India relations (see figure 24). Again, contrary to the emerging narrative, Indian Americans favor the Democratic Party to the Republican Party by a greater than two-to-one margin. Thirty-nine percent of respondents reported that the Democratic Party does a better job on U.S.-India relations while 18 percent believe the Republican Party is better, although this may well reflect their underlying preferences for the Democratic Party. Twenty-six percent believe it makes no difference, while another 16 percent reported they didn’t know.

Importance of U.S.-India relations as a voting issue
As the discussion above noted, respondents do not consider U.S.-India relations to be one of the principal determinants of their vote choice. The survey asked respondents to rank their top three most important issues that will influence their support for candidates in the November presidential election. Whereas the earlier analysis looked only at respondents’ foremost priorities, one can also take a broader look at their top three rankings (see table 6).
Doing so reveals that the issue of U.S.-India relations is among the least important influencers of respondents’ vote choice. Just 3 percent named it as their number one issue (only sexism/gender discrimination was chosen less often). Four percent named it as their second-most important issue, and 4 percent named it as their third-most important issue (ahead of sexism/gender discrimination and terrorism).

Separately, the survey also asked respondents how important a candidate’s position on India will be for them personally in determining whom they will vote for this November. The results indicate a variety of responses. Just 7 percent reported that a candidate’s position on India will be one of the most important issues shaping their vote choice. Fifty-one percent of respondents reported it will either be very important or somewhat important, and 36 percent indicated it will be not at all important or not too important.
One clear takeaway is that while a candidate’s position on India matters to Indian Americans, a very small minority (7 percent) would go so far as to name it as one of the most important determinants of their vote choice—perhaps because of the exceptional domestic circumstances and stakes of this election. This finding is consistent with the self-reported ranking of the policy issues enumerated above and confirms the findings of other surveys that report that the sheer weight of domestic concerns in this election are outweighing foreign policy issues for all voters, including Indian Americans. While India might be viewed as an important voting consideration in isolation, when considered in the context of competing priorities, it rarely floats to the top.
The Modi factor
To what extent is Modi an election issue in the United States? India has been in the spotlight in this election like never before. Some have argued this is, in part, due to the polarized views of the prime minister, which could be coloring Indian Americans’ voting decisions.42 Because the Trump campaign has advanced the idea that Modi has endorsed his reelection and the fact that some Democratic lawmakers have voiced concern about India’s democratic trajectory under Modi, this is a question worth taking seriously.43
The survey shows a modest amount of polarization centered on the identity of the prime minister, although it is difficult to make the logical leap that this is necessarily an important, let alone key, driver of voting behavior. The survey asked respondents to place Modi on a feeling thermometer scale of 0–100 (identical to the one they placed U.S. political actors on). The mean rating for Modi on this scale is 55. This places the Indian leader somewhere between Indian Americans’ ratings of Biden and Trump.
However, the ratings do differ somewhat by partisan preference (see figure 25). Trump voters give Modi the highest rating (76), followed by Republicans (70). Democrats, on the other hand, give Modi a rating of 55, while Biden voters give Modi the lowest rating (52). Independents find themselves in the middle of the pack, granting Modi a rating of 58. While the differences between Trump voters and Republicans or Biden voters and Democrats are not that significant, the gap between supporters of the two parties and presidential candidates is large—more than twenty points from one extreme to the other. Yet overall, even for the more skeptical Biden voters and Democrats, Modi’s rating still falls on the “warm” end of the thermometer scale (since it is greater than 50).

Finally, the survey asked respondents whether they approve of the job that Modi is doing as prime minister. Forty-eight percent of Indian Americans approve of Modi’s performance, and 32 percent disapprove (20 percent express no opinion). However, Indian Americans who approve of Trump’s performance are also more likely to approve of Modi’s performance: 66 percent of those who approve of Trump also approve of Modi. Very few Indian Americans who approve of Trump disapprove of Modi (just 18 percent of respondents are in this category).
However, those who disapprove of Trump are roughly equally split on Modi: 41 percent of those who disapprove of Trump approve of Modi, while 38 percent disapprove of him. What this result suggests is that there may be a floor to Modi’s favorability; while Trump supporters have a higher opinion of Modi, Trump’s detractors are divided on their views on the Indian prime minister.44
CONCLUSION
The substantial majority of Indian Americans continue to support the Democratic Party, largely support policy measures espoused by voices on the political left, and harbor continued skepticism about the Republican Party. However, the community is not a monolith, and the IAAS helps shed much-needed light on the variation that exists within the Indian American community in the United States.
Looking forward, each year, approximately 150,000 Indian Americans will become newly eligible to vote—a third through naturalization and the rest are children of immigrants reaching voting age.45 Given these demographic trends, and the more liberal leanings of U.S.-born Indian Americans, it is likely that the median Indian American voter will become even more inclined to the policy stances of the Democratic Party. If curbs on immigration to the United States continue, that trend could intensify even further.
While anecdotal evidence suggests some in the Indian American community are concerned that U.S.-India relations could suffer under a potential Democratic administration, two caveats are in order. First, the survey shows that Indian Americans broadly believe that Democrats will be reasonable stewards of the bilateral relationship. Second, the data in this study reinforce the fact that foreign policy is not a primary shaper of Indian American voter behavior in this election. This should not be surprising given how much people’s lives have been upended by the coronavirus pandemic, a grim economic recession, and repeated convulsions over race and social justice.
To be sure, there are several ways in which the Indian American community bucks accepted political wisdom. The gender gap in partisan attitudes, rife in U.S. politics, is not pronounced among Indian Americans. And a majority of Indian Americans, regardless of age or educational profile, intend to vote for the Democratic presidential candidate in November—something that is not true of older Americans (above the age of sixty-five) or those without a college degree.46
But, in terms of their focus on bread-and-butter issues or the polarization between opposing partisans, Indian Americans are behaving in sync with the American populace at large—a sign that the community is finding its own place in the patchwork American story.
APPENDIX A: METHODOLOGY
Respondents for this survey were recruited from an existing panel administered by YouGov. YouGov maintains a proprietary, double opt-in survey panel comprised of 1.8 million U.S. residents who have agreed to participate in YouGov’s surveys.
ONLINE PANEL SURVEYS
Online panels are not the same as traditional, probability-based surveys. However, thanks to the decline in response rates, the rise of the internet and smartphone penetration, and the evolution in statistical techniques, nonprobability panels—such as the one YouGov employs—have quickly become the norm in survey research.47 This election cycle, for instance, the Economist has partnered with YouGov to track the presidential election and political attitudes using a customized panel.48
RESPONDENT SELECTION AND SAMPLING DESIGN
The data for this survey are based on a unique survey of 1,200 people of Indian origin conducted between September 1 and September 20, 2020. To provide an accurate picture of the Indian American community as a whole, the full sample contains both U.S. citizens and non-U.S. citizens. Given the fact that the majority of younger Indian Americans below age twenty-seven are born in the United States while the opposite is true of those above age twenty-seven, YouGov oversampled younger Indian Americans between the ages of eighteen and twenty-seven to ensure that the study’s analyses can make inferences about generational differences within the Indian American community.
SAMPLE MATCHING
To produce the final dataset, respondents were matched to a sampling frame on gender, age, and education. The main sample was matched to a frame corresponding to all adult Indian Americans, and the oversample was matched to a frame corresponding to Indian Americans ages eighteen to twenty-seven. Both frames were constructed by stratified sampling from the full 2018 ACS one-year sample. Within strata, matches were selected by weighted sampling with replacements (using the person weights on the ACS public use file).
The matched cases were weighted to the sampling frames using propensity scores. The matched cases and the frames were combined, and a logistic regression was estimated for inclusion in the frames. The propensity score function included age, gender, years of education, and region. The propensity scores were grouped into deciles of the estimated propensity score in the frames and post-stratified according to these deciles.49
Sampling weights were then post-stratified on 2016 presidential vote choice, as well as a three-way stratification of gender, age (four categories), and education (four categories), to produce the final weight.
DATA ANALYSIS AND SOURCES OF ERROR
All of the analyses in this study were conducted using the statistical software R and employ sample weights to ensure representativeness.
The margin of error for the full sample of 1,200 respondents is +/- 2.8 percent. The analyses in this study focus on the U.S. citizen sub-sample of the data (N=936), which has a margin of error of +/- 3.2 percent.
For analyses in this study that focus on registered voters (N=842), the margin of error is +/- 3.4 percent. For analyses that focus on self-identified Democrats and Republicans (N=677), the margin of error is +/- 3.8. All margins are calculated at the 95 percent confidence interval.
Figure 26 provides the geographic distribution of survey respondents by state of residence.

APPENDIX B: SURVEY TOPLINE
We would like to acknowledge numerous individuals and organizations for making this study possible. We are grateful to Ashley Grosse, Alexander Marsolais, and their colleagues at YouGov for their help with the design and execution of the survey. Tobin Hansen of Carnegie provided excellent research assistance and contributed both to the design and the analysis of the survey. Jashan Bajwa, a graduate student at Johns Hopkins University’s School of Advanced International Studies, helped us analyze the ACS data, and we are grateful for her support. Jonathan Kay also provided additional research assistance.
We owe a special thanks to Georgette Rochlin and Tariq Thachil of the Center for the Advanced Study of India at the University of Pennsylvania. Tariq, in literally his first few hours in his new job, helped us get this project off the ground. This project has been reviewed and approved by the University of Pennsylvania Institutional Review Board (Protocol #843855).
We are collaborating with three recent graduates of the University of Southern California—Srividya Dasaraju, Sahit Menon, and Sameer Nair-Desaion a separate, ongoing project on Indian Americans, but we would like to thank them for their feedback and assistance on this project as well.
At Carnegie, we owe special thanks to Samuel Brase for his careful (yet swift) editing of this publication. We would also like to acknowledge Courtney Griffith and Jocelyn Soly for contributing their considerable graphic design talents. Douglas Farrar, Cliff Djajapranata, Fiona Garguilo, Jessica Katz, Maya Krishna-Rogers, Laura Lucas Magnuson, Tim Martin, Amy Mellon, Lori Merritt, and Cameron Zotter contributed design, editorial, and production assistance.
While we are grateful to all of our collaborators, any errors found in this study are entirely the authors’.
No comments:
Post a Comment